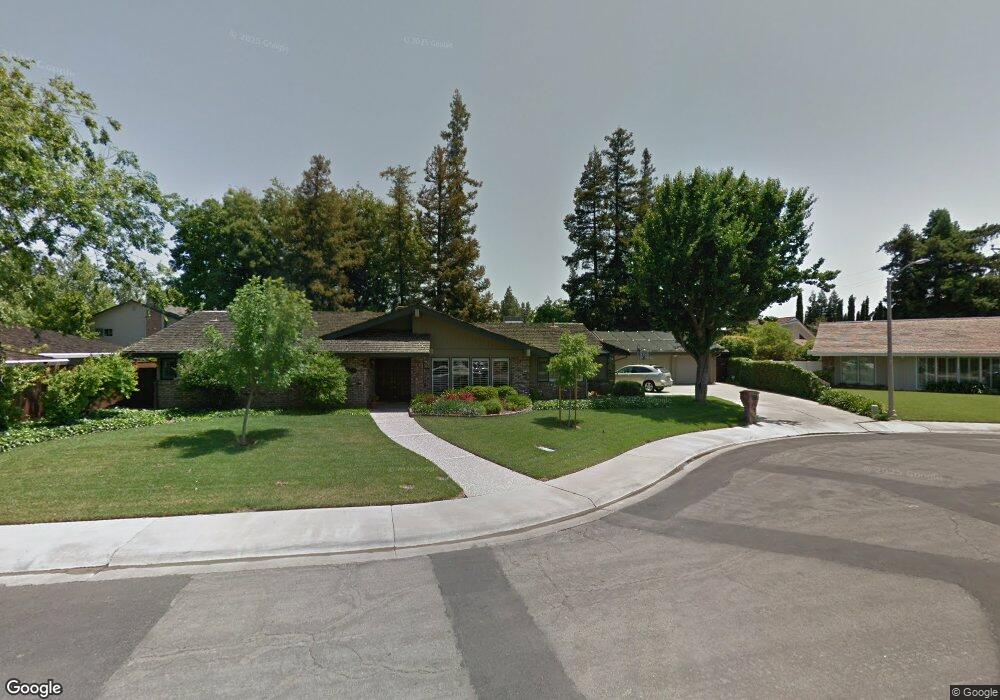
1605 Baylor Ct Woodland, CA 95695
Estimated Value: $815,000 - $1,138,000
4
Beds
4
Baths
3,395
Sq Ft
$291/Sq Ft
Est. Value
About This Home
This home is located at 1605 Baylor Ct, Woodland, CA 95695 and is currently estimated at $987,529, approximately $290 per square foot. 1605 Baylor Ct is a home located in Yolo County with nearby schools including Zamora Elementary School, Lee Middle School, and Woodland Senior High School.
Ownership History
Date
Name
Owned For
Owner Type
Purchase Details
Closed on
Dec 17, 2002
Sold by
Hoppin Lawrence W and Hoppin Deborah E
Bought by
Hoppin Lawrence W and Hoppin Deborah E
Current Estimated Value
Purchase Details
Closed on
Apr 30, 1999
Sold by
Hoppin Lawrence W and Hoppin Deborah E
Bought by
Hoppin Lawrence W and Hoppin Deborah E
Purchase Details
Closed on
Jun 23, 1997
Sold by
Lopez Darren F and Lopez Kristina
Bought by
Hoppin Lawrence W and Hoppin Deborah E
Home Financials for this Owner
Home Financials are based on the most recent Mortgage that was taken out on this home.
Original Mortgage
$46,000
Interest Rate
7.91%
Purchase Details
Closed on
Jun 11, 1997
Sold by
Naekel James W Tr
Bought by
Hoppin Lawrence W and Hoppin Deborah E
Home Financials for this Owner
Home Financials are based on the most recent Mortgage that was taken out on this home.
Original Mortgage
$46,000
Interest Rate
7.91%
Create a Home Valuation Report for This Property
The Home Valuation Report is an in-depth analysis detailing your home's value as well as a comparison with similar homes in the area
Home Values in the Area
Average Home Value in this Area
Purchase History
| Date | Buyer | Sale Price | Title Company |
|---|---|---|---|
| Hoppin Lawrence W | -- | First American Title | |
| Hoppin Lawrence W | -- | -- | |
| Hoppin Lawrence W | -- | -- | |
| Hoppin Lawrence W | -- | -- | |
| Hoppin Lawrence W | -- | -- | |
| Hoppin Lawrence W | $114,000 | North American Title Co | |
| Hoppin Lawrence W | $218,000 | North American Title Co |
Source: Public Records
Mortgage History
| Date | Status | Borrower | Loan Amount |
|---|---|---|---|
| Closed | Hoppin Lawrence W | $46,000 | |
| Open | Hoppin Lawrence W | $163,000 |
Source: Public Records
Tax History Compared to Growth
Tax History
| Year | Tax Paid | Tax Assessment Tax Assessment Total Assessment is a certain percentage of the fair market value that is determined by local assessors to be the total taxable value of land and additions on the property. | Land | Improvement |
|---|---|---|---|---|
| 2025 | $5,283 | $519,592 | $97,187 | $422,405 |
| 2023 | $5,283 | $499,417 | $93,414 | $406,003 |
| 2022 | $5,073 | $489,626 | $91,583 | $398,043 |
| 2021 | $4,991 | $480,027 | $89,788 | $390,239 |
| 2020 | $4,919 | $475,106 | $88,868 | $386,238 |
| 2019 | $4,825 | $465,791 | $87,126 | $378,665 |
| 2018 | $4,775 | $456,659 | $85,418 | $371,241 |
| 2017 | $4,670 | $447,706 | $83,744 | $363,962 |
| 2016 | $4,589 | $438,928 | $82,102 | $356,826 |
| 2015 | $4,433 | $432,336 | $80,869 | $351,467 |
| 2014 | $4,433 | $423,868 | $79,285 | $344,583 |
Source: Public Records
Map
Nearby Homes
- 206 Los Robles Way
- 1240 Eunice Dr
- 1208 West St
- 1609 Mckinley Ave
- 754 Fordham Place
- 633 Poplar Ln
- 1200 Evergreen Ct
- 837 Lewis Ave
- 6 Southwood Dr
- 615 Knollwood Dr
- 637 Knollwood Dr
- 420 Delta Dr
- 420 W Southwood Dr
- 423 El Dorado Dr
- 436 Abbey Place
- 909 Harvard Place
- 801-803 California St
- 1328 College St
- 910 Notre Dame Dr
- 205 Bartlett Ave
- 313 Los Robles Way
- 1609 Baylor Ct
- 209 Los Robles Way
- 1608 Midway Dr
- 205 Los Robles Way
- 1604 Baylor Ct
- 1608 Baylor Ct
- 1612 Baylor Ct
- 1612 Midway Dr
- 401 Los Robles Way
- 312 Los Robles Way
- 1616 Midway Dr
- 308 W El Dorado Dr
- 304 W El Dorado Dr
- 400 W El Dorado Dr
- 403 Los Robles Way
- 3 El Dorado Ct
- 404 W El Dorado Dr
- 400 Los Robles Way
- 1620 Midway Dr