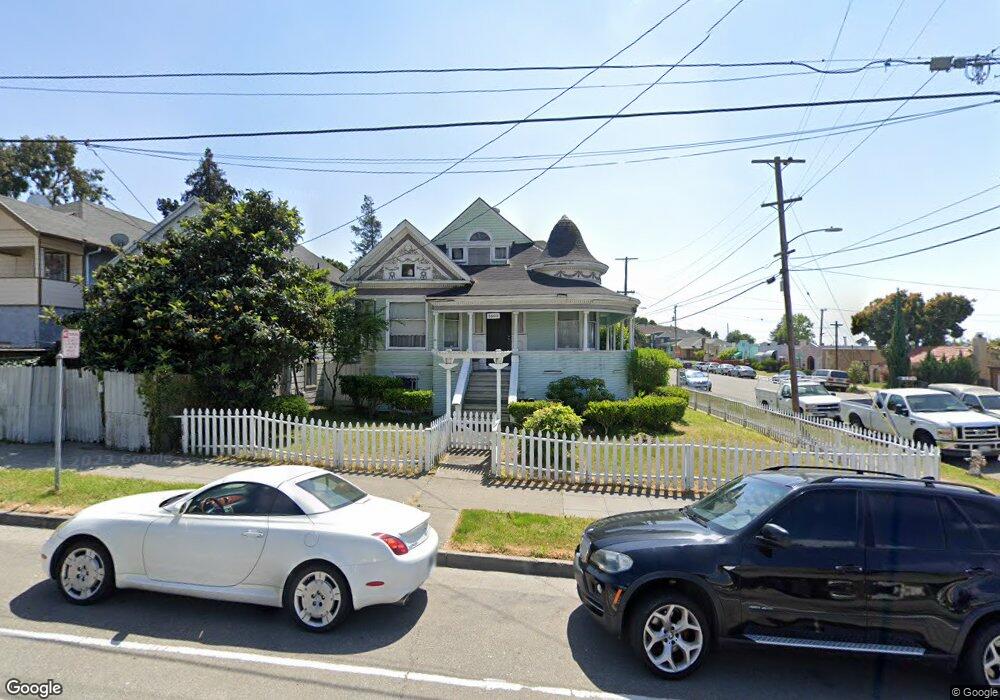
1605 E 21st St Oakland, CA 94606
San Antonio NeighborhoodEstimated Value: $512,265 - $625,000
5
Beds
1
Bath
1,392
Sq Ft
$404/Sq Ft
Est. Value
About This Home
This home is located at 1605 E 21st St, Oakland, CA 94606 and is currently estimated at $562,066, approximately $403 per square foot. 1605 E 21st St is a home located in Alameda County with nearby schools including Garfield Elementary School, Roosevelt Middle School, and Oakland High School.
Ownership History
Date
Name
Owned For
Owner Type
Purchase Details
Closed on
Jun 11, 2020
Sold by
Lucero Larry C and Lucero Katherine
Bought by
Lucero Larry Crestino and Lucero Kathy
Current Estimated Value
Purchase Details
Closed on
Jun 9, 2017
Sold by
Leon Emilie E
Bought by
Leon Emilie E and Emilie E Leon 2017 Trust
Purchase Details
Closed on
Jun 15, 2016
Sold by
Leon Emilie E
Bought by
Leon Emilie E
Create a Home Valuation Report for This Property
The Home Valuation Report is an in-depth analysis detailing your home's value as well as a comparison with similar homes in the area
Home Values in the Area
Average Home Value in this Area
Purchase History
| Date | Buyer | Sale Price | Title Company |
|---|---|---|---|
| Lucero Larry Crestino | -- | None Available | |
| Leon Emilie E | -- | None Available | |
| Leon Emilie E | -- | None Available |
Source: Public Records
Tax History
| Year | Tax Paid | Tax Assessment Tax Assessment Total Assessment is a certain percentage of the fair market value that is determined by local assessors to be the total taxable value of land and additions on the property. | Land | Improvement |
|---|---|---|---|---|
| 2025 | $2,603 | $54,539 | $41,190 | $20,349 |
| 2024 | $2,603 | $53,332 | $40,382 | $19,950 |
| 2023 | $2,590 | $59,149 | $39,590 | $19,559 |
| 2022 | $2,440 | $50,990 | $38,814 | $19,176 |
| 2021 | $2,169 | $49,853 | $38,053 | $18,800 |
| 2020 | $2,140 | $56,270 | $37,663 | $18,607 |
| 2019 | $1,955 | $55,167 | $36,925 | $18,242 |
| 2018 | $1,914 | $54,086 | $36,201 | $17,885 |
| 2017 | $1,801 | $53,025 | $35,491 | $17,534 |
| 2016 | $1,641 | $51,985 | $34,795 | $17,190 |
| 2015 | $1,624 | $51,204 | $34,272 | $16,932 |
| 2014 | $1,467 | $50,201 | $33,601 | $16,600 |
Source: Public Records
Map
Nearby Homes
- 2212 17th Ave
- 1736 E 21st St
- 1739 E 22nd St
- 1641 E 20th St
- 1747 E 22nd St
- 1140 E 22nd St
- 2138 19th Ave
- 2301 12th Ave
- 1839 Commerce Way
- 1737 13th Ave
- 1810 E 25th St
- 2036 E 20th St
- 1900 21st Ave
- 1364 E 27th St
- 1533 14th Ave
- 925 E 19th St
- 2134 E 21st St
- 2445 10th Ave
- 2505 10th Ave
- 1515 14th Ave Unit 302
Your Personal Tour Guide
Ask me questions while you tour the home.