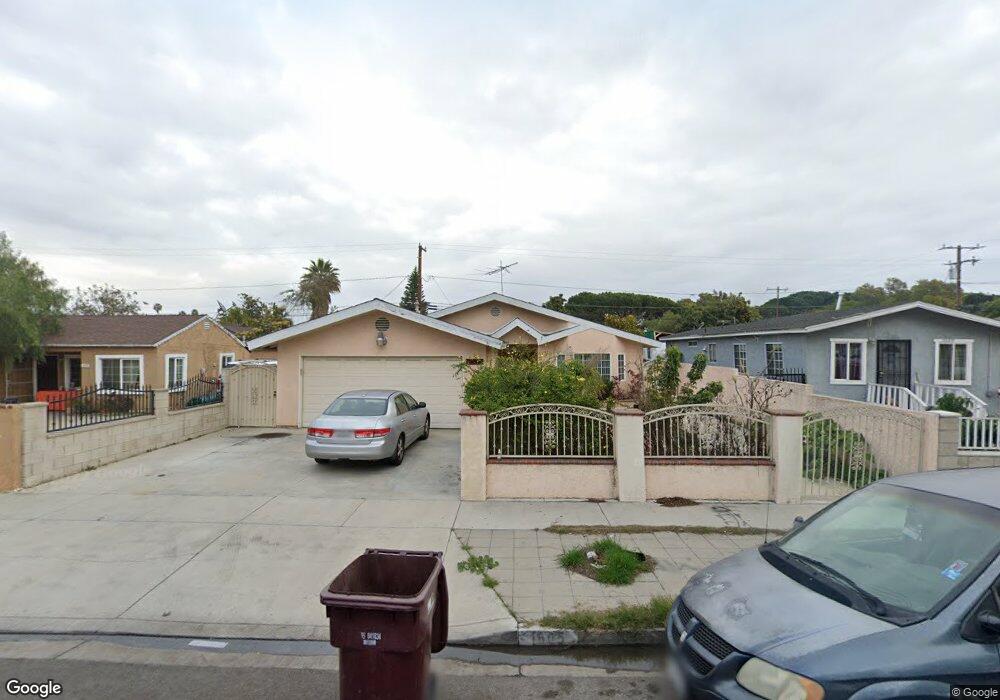
1605 S Diamond St Santa Ana, CA 92704
Valley Adams NeighborhoodEstimated Value: $1,024,000 - $1,183,191
4
Beds
4
Baths
2,226
Sq Ft
$491/Sq Ft
Est. Value
About This Home
This home is located at 1605 S Diamond St, Santa Ana, CA 92704 and is currently estimated at $1,093,798, approximately $491 per square foot. 1605 S Diamond St is a home located in Orange County with nearby schools including Carl Harvey Elementary School, Gerald P. Carr Intermediate School, and Valley High School.
Ownership History
Date
Name
Owned For
Owner Type
Purchase Details
Closed on
Aug 13, 2001
Sold by
Vanvanbui Larry Van and Bui Tina Thu
Bought by
Lee Andy Han and Ly Todd
Current Estimated Value
Home Financials for this Owner
Home Financials are based on the most recent Mortgage that was taken out on this home.
Original Mortgage
$165,000
Outstanding Balance
$64,131
Interest Rate
7.1%
Estimated Equity
$1,029,667
Purchase Details
Closed on
Aug 7, 2001
Sold by
Wang Xiao Hua
Bought by
Lee Andy Han
Home Financials for this Owner
Home Financials are based on the most recent Mortgage that was taken out on this home.
Original Mortgage
$165,000
Outstanding Balance
$64,131
Interest Rate
7.1%
Estimated Equity
$1,029,667
Purchase Details
Closed on
Jan 20, 1999
Sold by
Medina Edward and Medina Kathryn L
Bought by
Vanvanbui Larry Van and Bui Tina Thu
Purchase Details
Closed on
Feb 21, 1997
Sold by
Guedea Kathryn L and Guedea Kathryn L
Bought by
Medina Edward and Medina Kathryn L
Create a Home Valuation Report for This Property
The Home Valuation Report is an in-depth analysis detailing your home's value as well as a comparison with similar homes in the area
Home Values in the Area
Average Home Value in this Area
Purchase History
| Date | Buyer | Sale Price | Title Company |
|---|---|---|---|
| Lee Andy Han | $265,000 | Fidelity National Title Ins | |
| Lee Andy Han | -- | Fidelity National Title Ins | |
| Vanvanbui Larry Van | $67,000 | Southland Title Corporation | |
| Medina Edward | -- | American Title Ins Co |
Source: Public Records
Mortgage History
| Date | Status | Borrower | Loan Amount |
|---|---|---|---|
| Open | Lee Andy Han | $165,000 |
Source: Public Records
Tax History Compared to Growth
Tax History
| Year | Tax Paid | Tax Assessment Tax Assessment Total Assessment is a certain percentage of the fair market value that is determined by local assessors to be the total taxable value of land and additions on the property. | Land | Improvement |
|---|---|---|---|---|
| 2025 | $4,661 | $391,472 | $135,909 | $255,563 |
| 2024 | $4,661 | $383,797 | $133,245 | $250,552 |
| 2023 | $4,545 | $376,272 | $130,632 | $245,640 |
| 2022 | $4,497 | $368,895 | $128,071 | $240,824 |
| 2021 | $4,393 | $361,662 | $125,560 | $236,102 |
| 2020 | $4,401 | $357,954 | $124,272 | $233,682 |
| 2019 | $4,316 | $350,936 | $121,836 | $229,100 |
| 2018 | $4,152 | $344,055 | $119,447 | $224,608 |
| 2017 | $4,117 | $337,309 | $117,105 | $220,204 |
| 2016 | $4,036 | $330,696 | $114,809 | $215,887 |
| 2015 | $3,986 | $325,729 | $113,084 | $212,645 |
| 2014 | $3,917 | $319,349 | $110,869 | $208,480 |
Source: Public Records
Map
Nearby Homes
- 2513 W Occidental St
- 2521 W Stanford St
- 1501 S Raitt St Unit 115
- 1838 S Artesia St
- 1912 W Wilshire Ave
- 2309 W Anahurst Place
- 2108 S Artesia St
- 2926 W La Verne Ave
- 2718 W Mcfadden Ave
- 1402 S Poplar St
- 2322 S Greenville St
- 2029 W Flora St
- 1411 W Elder Ave
- 803 S Sullivan St
- 2924 W Mcfadden Ave
- 1114 S Pacific Ave
- 2424 S Laurelwood Unit 143
- 631 S Fairview St Unit 4F
- 625 Shelley St
- 3510 & 3512 W Pine St
- 1609 S Diamond St
- 1601 S Diamond St
- 1533 S Diamond St
- 1613 S Diamond St
- 1606 S Center St
- 1610 S Center St
- 1602 S Center St
- 1529 S Diamond St
- 1534 S Center St
- 1614 S Center St
- 1606 S Diamond St
- 1610 S Diamond St
- 1602 S Diamond St
- 1525 S Diamond St
- 1616 S Diamond St
- 1621 S Diamond St
- 1532 S Diamond St
- 2202 W Pomona St
- 2236 W Stanford St
- 1521 S Diamond St