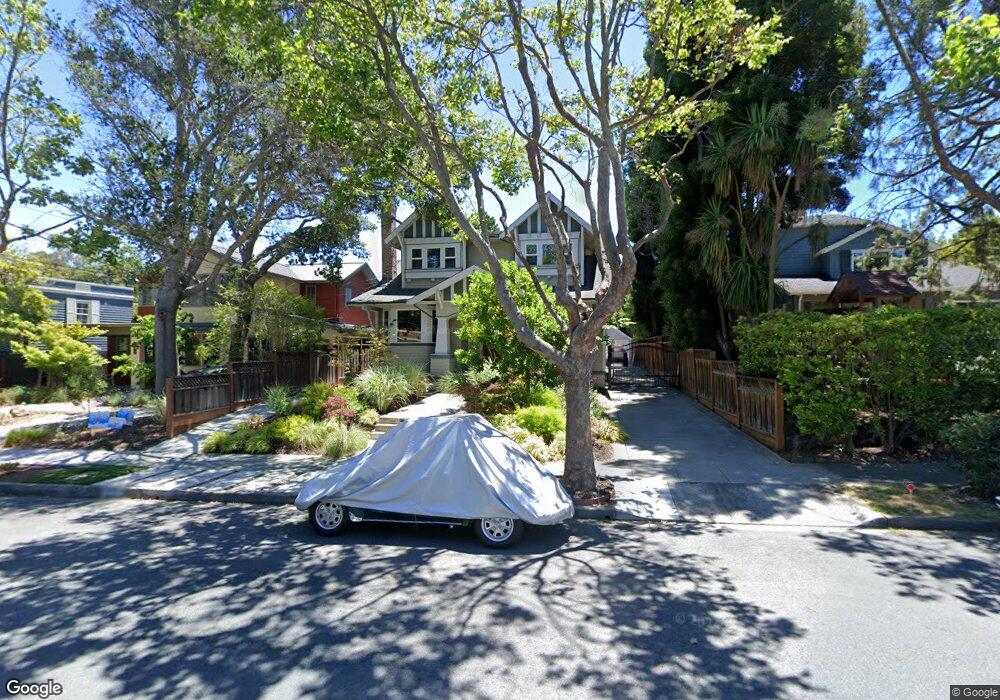
1605 Sanchez Ave Burlingame, CA 94010
Burlingame Terrace NeighborhoodEstimated Value: $2,531,000 - $4,245,000
4
Beds
4
Baths
3,260
Sq Ft
$1,106/Sq Ft
Est. Value
About This Home
This home is located at 1605 Sanchez Ave, Burlingame, CA 94010 and is currently estimated at $3,604,536, approximately $1,105 per square foot. 1605 Sanchez Ave is a home located in San Mateo County with nearby schools including McKinley Elementary School, Burlingame Intermediate School, and Burlingame High School.
Ownership History
Date
Name
Owned For
Owner Type
Purchase Details
Closed on
Mar 22, 2012
Sold by
Schlesinger Gaird and Schlesinger Maryse
Bought by
Schlesinger Gaird L and Schlesinger Maryse K
Current Estimated Value
Purchase Details
Closed on
Apr 26, 2002
Sold by
Keighran Kevin E and Keighran Caroline
Bought by
Schlesinger Gaird and Schlesinger Maryse
Home Financials for this Owner
Home Financials are based on the most recent Mortgage that was taken out on this home.
Original Mortgage
$637,000
Outstanding Balance
$260,826
Interest Rate
6.5%
Estimated Equity
$3,343,710
Purchase Details
Closed on
Jan 4, 1999
Sold by
Elizabeth Carmack Dona Lou
Bought by
Keighran Kevin E and Keighran Caroline
Home Financials for this Owner
Home Financials are based on the most recent Mortgage that was taken out on this home.
Original Mortgage
$400,000
Interest Rate
7.12%
Create a Home Valuation Report for This Property
The Home Valuation Report is an in-depth analysis detailing your home's value as well as a comparison with similar homes in the area
Home Values in the Area
Average Home Value in this Area
Purchase History
| Date | Buyer | Sale Price | Title Company |
|---|---|---|---|
| Schlesinger Gaird L | -- | None Available | |
| Schlesinger Gaird | $850,000 | Fidelity National Title Co | |
| Keighran Kevin E | $550,000 | First American Title Co |
Source: Public Records
Mortgage History
| Date | Status | Borrower | Loan Amount |
|---|---|---|---|
| Open | Schlesinger Gaird | $637,000 | |
| Previous Owner | Keighran Kevin E | $400,000 |
Source: Public Records
Tax History Compared to Growth
Tax History
| Year | Tax Paid | Tax Assessment Tax Assessment Total Assessment is a certain percentage of the fair market value that is determined by local assessors to be the total taxable value of land and additions on the property. | Land | Improvement |
|---|---|---|---|---|
| 2025 | $19,300 | $1,722,923 | $1,107,968 | $614,955 |
| 2023 | $19,300 | $1,656,023 | $1,064,946 | $591,077 |
| 2022 | $18,612 | $1,623,553 | $1,044,065 | $579,488 |
| 2021 | $18,636 | $1,591,720 | $1,023,594 | $568,126 |
| 2020 | $18,248 | $1,575,400 | $1,013,099 | $562,301 |
| 2019 | $17,843 | $1,544,511 | $993,235 | $551,276 |
| 2018 | $17,503 | $1,514,227 | $973,760 | $540,467 |
| 2017 | $17,374 | $1,484,537 | $954,667 | $529,870 |
| 2016 | $16,735 | $1,455,430 | $935,949 | $519,481 |
| 2015 | $16,660 | $1,433,569 | $921,891 | $511,678 |
| 2014 | $16,417 | $1,405,488 | $903,833 | $501,655 |
Source: Public Records
Map
Nearby Homes
- 1735 Crockett Ln
- 824 El Camino Real
- 1115 Capuchino Ave
- 1044 Paloma Ave
- 1315 Carmelita Ave
- 1111 Laguna Ave
- 1137 Paloma Ave Unit E
- 1500 Broadway Unit 205
- 818 Irwin Dr
- 735 El Camino Real Unit 104
- 680 Fairway Cir
- 732 Paloma Ave
- 1217 Paloma Ave Unit 3
- 1237 Capuchino Ave Unit 7
- 8 Reynolds Ct
- 1515 Floribunda Ave Unit 309
- 1515 Floribunda Ave Unit 302
- 550 El Camino Real Unit 302
- 1030 Morrell Ave
- 1300 Paloma Ave
- 1601 Sanchez Ave
- 1609 Sanchez Ave
- 1521 Sanchez Ave
- 1613 Sanchez Ave
- 1614 Forest View Ave
- 1517 Sanchez Ave
- 1610 Forest View Ave
- 1620 Forest View Ave
- 1617 Sanchez Ave
- 1602 Forest View Ave
- 1622 Forest View Ave
- 1513 Sanchez Ave
- 1001 Balboa Ave
- 1600 Forest View Ave
- 1604 Sanchez Ave
- 1624 Forest View Ave
- 950 Newhall Rd
- 1000 Balboa Ave
- 1520 Forest View Ave
- 1608 Sanchez Ave