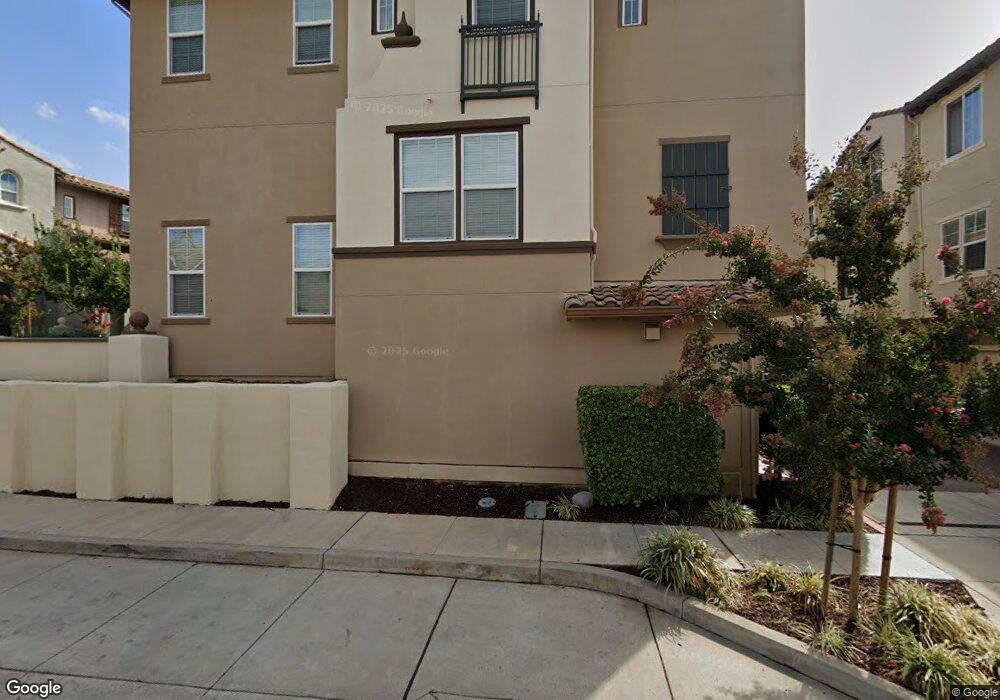
1605 Trailside Cir Concord, CA 94518
Cowell Terrace NeighborhoodEstimated Value: $586,000 - $837,000
3
Beds
3
Baths
1,332
Sq Ft
$498/Sq Ft
Est. Value
About This Home
This home is located at 1605 Trailside Cir, Concord, CA 94518 and is currently estimated at $663,644, approximately $498 per square foot. 1605 Trailside Cir is a home located in Contra Costa County with nearby schools including El Monte Elementary School, El Dorado Middle School, and Mt. Diablo High School.
Ownership History
Date
Name
Owned For
Owner Type
Purchase Details
Closed on
Oct 9, 2019
Sold by
Bell Adrienne Lynn and Bell Adrienne Lynne
Bought by
Rohilcek John G and Rohlicek Susan R
Current Estimated Value
Purchase Details
Closed on
Mar 18, 2015
Sold by
Thomson Mitchell S and Thomson Karen A
Bought by
Bell Adrienne Lynne
Home Financials for this Owner
Home Financials are based on the most recent Mortgage that was taken out on this home.
Original Mortgage
$427,453
Interest Rate
3.71%
Mortgage Type
New Conventional
Purchase Details
Closed on
Oct 30, 2009
Sold by
Taylor Morrison Of California Llc
Bought by
Thomson Mitchell S and Thomson Karen A
Home Financials for this Owner
Home Financials are based on the most recent Mortgage that was taken out on this home.
Original Mortgage
$254,205
Interest Rate
5.02%
Mortgage Type
New Conventional
Purchase Details
Closed on
Dec 31, 2007
Sold by
Morrison Homes Inc
Bought by
Taylor Morrison Of California Llc
Create a Home Valuation Report for This Property
The Home Valuation Report is an in-depth analysis detailing your home's value as well as a comparison with similar homes in the area
Home Values in the Area
Average Home Value in this Area
Purchase History
| Date | Buyer | Sale Price | Title Company |
|---|---|---|---|
| Rohilcek John G | $563,000 | Fidelity National Title Co | |
| Bell Adrienne Lynne | $475,000 | Pacific Coast Title Company | |
| Thomson Mitchell S | $318,000 | First American Title Company | |
| Taylor Morrison Of California Llc | -- | First American Title |
Source: Public Records
Mortgage History
| Date | Status | Borrower | Loan Amount |
|---|---|---|---|
| Previous Owner | Bell Adrienne Lynne | $427,453 | |
| Previous Owner | Thomson Mitchell S | $254,205 |
Source: Public Records
Tax History
| Year | Tax Paid | Tax Assessment Tax Assessment Total Assessment is a certain percentage of the fair market value that is determined by local assessors to be the total taxable value of land and additions on the property. | Land | Improvement |
|---|---|---|---|---|
| 2025 | $7,782 | $615,718 | $317,155 | $298,563 |
| 2024 | $7,439 | $603,646 | $310,937 | $292,709 |
| 2023 | $7,439 | $591,811 | $304,841 | $286,970 |
| 2022 | $7,339 | $580,208 | $298,864 | $281,344 |
| 2021 | $7,159 | $568,832 | $293,004 | $275,828 |
| 2019 | $6,487 | $511,758 | $215,478 | $296,280 |
| 2018 | $6,237 | $501,724 | $211,253 | $290,471 |
| 2017 | $6,027 | $491,887 | $207,111 | $284,776 |
| 2016 | $5,857 | $482,243 | $203,050 | $279,193 |
| 2015 | $4,300 | $341,215 | $193,323 | $147,892 |
| 2014 | $4,212 | $334,532 | $189,537 | $144,995 |
Source: Public Records
Map
Nearby Homes
- 1509 Trailside Cir
- 3200 Sheffield Place
- 2722 Cowell Rd
- 1080 San Miguel Rd Unit 134
- 3124 Mount Diablo St
- 2861 Mount Diablo St
- 2860 Laguna St
- 96 Welcome Ave
- 65 Palm Ln
- 6 Hanford Ave
- 26 David Dr
- 18 Galloway Dr
- 32 Galloway Dr
- 141 Scenic Dr
- 36 Galloway Dr
- 42 Galloway Dr
- 81 Eileen Ln
- 177 Rose Marie Ln
- 1255 Detroit Ave Unit 14
- 1800 Laguna St Unit 5
- 1607 Trailside Cir
- 1603 Trailside Cir
- 1609 Trailside Cir
- 1601 Trailside Cir
- 1507 Trailside Cir
- 1707 Trailside Cir
- 1703 Trailside Cir
- 1505 Trailside Cir
- 1507 Trailside Cir
- 1705 Trailside Cir
- 1709 Trailside Cir
- 1501 Trailside Cir
- 1701 Trailside Cir
- 1600 Trailside Cir
- 1650 Trailside Cir
- 1550 Trailside Cir
- 1813 Trailside Cir
- 1407 Trailside Cir
- 1700 Trailside Cir
- 1500 Trailside Cir
Your Personal Tour Guide
Ask me questions while you tour the home.