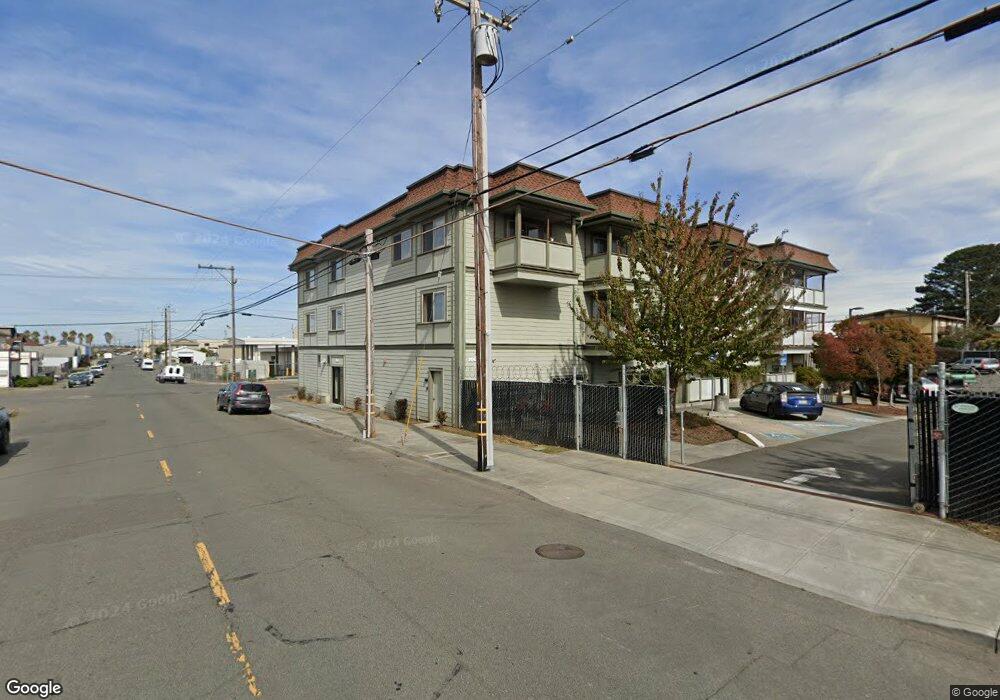
1605 Union St Eureka, CA 95501
Broadway Street Neighborhood
Studio
--
Bath
2,200
Sq Ft
19,602
Sq Ft Lot
About This Home
This home is located at 1605 Union St, Eureka, CA 95501. 1605 Union St is a home located in Humboldt County with nearby schools including Lafayette Elementary School, Catherine L. Zane Middle School, and Eureka Senior High School.
Ownership History
Date
Name
Owned For
Owner Type
Purchase Details
Closed on
Apr 19, 2006
Sold by
Westfall Kevin C and Westfall Carol F
Bought by
Yurok Indian Housing Authority
Purchase Details
Closed on
Jun 15, 1998
Sold by
Westfall Leslie M and Westfall Mildred M
Bought by
Westfall Kevin C and Westfall Carol F
Home Financials for this Owner
Home Financials are based on the most recent Mortgage that was taken out on this home.
Original Mortgage
$200,000
Interest Rate
7.01%
Mortgage Type
Seller Take Back
Purchase Details
Closed on
Jun 3, 1997
Sold by
Westfall Leslie M and Westfall Mildred M
Bought by
Westfall Leslie Miller and Westfall Mildred Knox Mcgowan
Create a Home Valuation Report for This Property
The Home Valuation Report is an in-depth analysis detailing your home's value as well as a comparison with similar homes in the area
Home Values in the Area
Average Home Value in this Area
Purchase History
| Date | Buyer | Sale Price | Title Company |
|---|---|---|---|
| Yurok Indian Housing Authority | $925,000 | First American Title Co | |
| Westfall Kevin C | -- | Humboldt Land Title Company | |
| Westfall Leslie Miller | -- | -- |
Source: Public Records
Mortgage History
| Date | Status | Borrower | Loan Amount |
|---|---|---|---|
| Previous Owner | Westfall Kevin C | $200,000 |
Source: Public Records
Tax History
| Year | Tax Paid | Tax Assessment Tax Assessment Total Assessment is a certain percentage of the fair market value that is determined by local assessors to be the total taxable value of land and additions on the property. | Land | Improvement |
|---|---|---|---|---|
| 2025 | $3,440 | $3,344,978 | $594,452 | $2,750,526 |
| 2024 | $3,440 | $3,279,392 | $582,797 | $2,696,595 |
| 2023 | $5,088 | $3,215,091 | $571,370 | $2,643,721 |
| 2022 | $1,760 | $3,152,051 | $560,167 | $2,591,884 |
| 2021 | $0 | $3,090,247 | $549,184 | $2,541,063 |
| 2020 | $0 | $3,058,561 | $543,553 | $2,515,008 |
| 2019 | $0 | $2,998,591 | $532,896 | $2,465,695 |
| 2018 | $0 | $2,939,797 | $522,448 | $2,417,349 |
| 2017 | $0 | $2,882,154 | $512,204 | $2,369,950 |
| 2016 | $0 | $2,825,642 | $502,161 | $2,323,481 |
| 2015 | -- | $2,783,200 | $494,619 | $2,288,581 |
| 2014 | -- | $526,310 | $484,931 | $41,379 |
Source: Public Records
Map
Nearby Homes
Your Personal Tour Guide
Ask me questions while you tour the home.