Estimated Value: $147,363 - $208,000
3
Beds
2
Baths
1,176
Sq Ft
$151/Sq Ft
Est. Value
About This Home
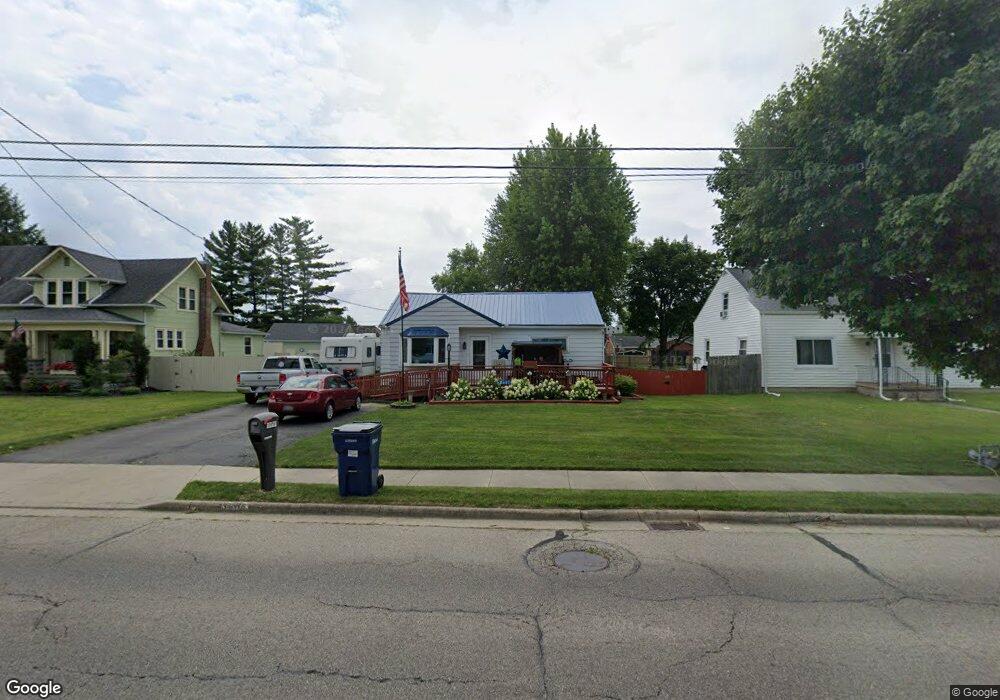
This home is located at 1605 W High St, Piqua, OH 45356 and is currently estimated at $177,591, approximately $151 per square foot. 1605 W High St is a home located in Miami County with nearby schools including Washington Primary School, Piqua Junior High School, and Piqua High School.
Ownership History
Date
Name
Owned For
Owner Type
Purchase Details
Closed on
Mar 27, 2018
Sold by
Mee Sandra J
Bought by
Mee Burnell W and Mee Sandra J
Current Estimated Value
Home Financials for this Owner
Home Financials are based on the most recent Mortgage that was taken out on this home.
Original Mortgage
$64,000
Outstanding Balance
$55,026
Interest Rate
4.43%
Mortgage Type
VA
Estimated Equity
$122,565
Purchase Details
Closed on
Aug 1, 1987
Bought by
Owens Sandra J
Create a Home Valuation Report for This Property
The Home Valuation Report is an in-depth analysis detailing your home's value as well as a comparison with similar homes in the area
Home Values in the Area
Average Home Value in this Area
Purchase History
| Date | Buyer | Sale Price | Title Company |
|---|---|---|---|
| Mee Burnell W | -- | None Available | |
| Owens Sandra J | -- | -- |
Source: Public Records
Mortgage History
| Date | Status | Borrower | Loan Amount |
|---|---|---|---|
| Open | Mee Burnell W | $64,000 |
Source: Public Records
Tax History Compared to Growth
Tax History
| Year | Tax Paid | Tax Assessment Tax Assessment Total Assessment is a certain percentage of the fair market value that is determined by local assessors to be the total taxable value of land and additions on the property. | Land | Improvement |
|---|---|---|---|---|
| 2024 | $931 | $32,450 | $11,380 | $21,070 |
| 2023 | $931 | $32,450 | $11,380 | $21,070 |
| 2022 | $991 | $32,450 | $11,380 | $21,070 |
| 2021 | $699 | $24,050 | $8,440 | $15,610 |
| 2020 | $685 | $24,050 | $8,440 | $15,610 |
| 2019 | $689 | $24,050 | $8,440 | $15,610 |
| 2018 | $600 | $21,460 | $8,440 | $13,020 |
| 2017 | $607 | $21,460 | $8,440 | $13,020 |
| 2016 | $600 | $21,460 | $8,440 | $13,020 |
| 2015 | $614 | $21,460 | $8,440 | $13,020 |
| 2014 | $614 | $21,460 | $8,440 | $13,020 |
| 2013 | $616 | $21,460 | $8,440 | $13,020 |
Source: Public Records
Map
Nearby Homes