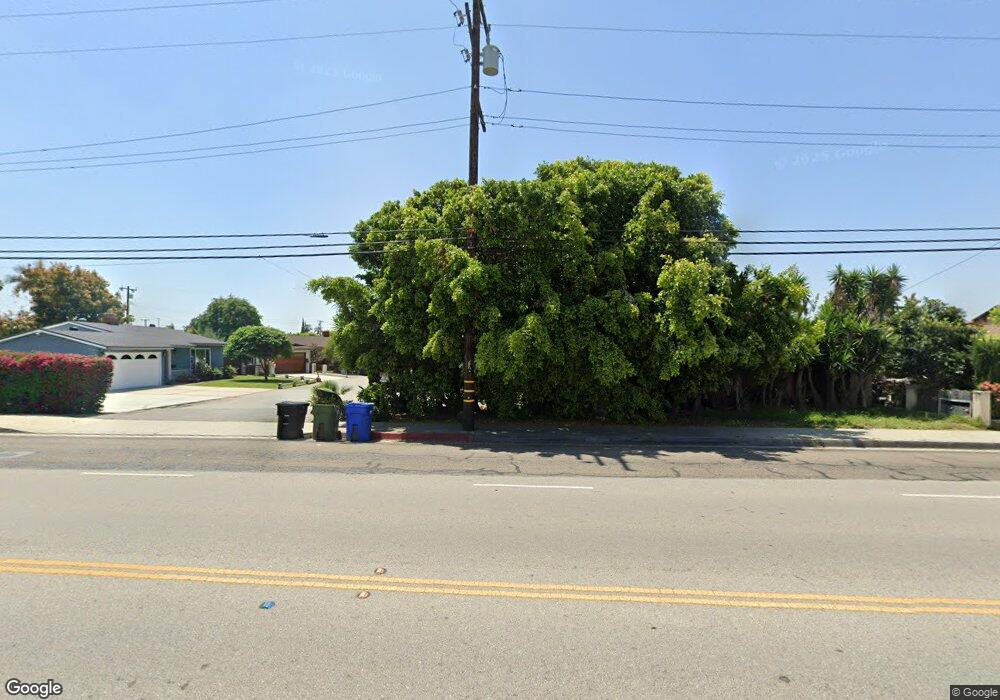
16054 E Cypress St Covina, CA 91722
Estimated Value: $695,000 - $796,000
3
Beds
2
Baths
1,572
Sq Ft
$478/Sq Ft
Est. Value
About This Home
This home is located at 16054 E Cypress St, Covina, CA 91722 and is currently estimated at $752,158, approximately $478 per square foot. 16054 E Cypress St is a home located in Los Angeles County with nearby schools including Merwin Elementary School, Las Palmas Middle School, and Northview High School.
Ownership History
Date
Name
Owned For
Owner Type
Purchase Details
Closed on
Mar 28, 2011
Sold by
Hill Alan R
Bought by
Hill Dina M
Current Estimated Value
Purchase Details
Closed on
Jun 27, 2006
Sold by
Hill Alan R and Hill Dina M
Bought by
Hill Alan R
Home Financials for this Owner
Home Financials are based on the most recent Mortgage that was taken out on this home.
Original Mortgage
$366,000
Outstanding Balance
$217,045
Interest Rate
6.63%
Mortgage Type
New Conventional
Estimated Equity
$535,113
Purchase Details
Closed on
Mar 30, 1999
Sold by
Hill Alan R and Hill Dina
Bought by
Hill Alan R
Home Financials for this Owner
Home Financials are based on the most recent Mortgage that was taken out on this home.
Original Mortgage
$123,750
Interest Rate
6.79%
Purchase Details
Closed on
Jan 22, 1999
Sold by
Garcia Carol A
Bought by
Hill Alan R
Purchase Details
Closed on
Nov 5, 1992
Sold by
Garcia Steven J
Bought by
Garcia Carol Ann
Create a Home Valuation Report for This Property
The Home Valuation Report is an in-depth analysis detailing your home's value as well as a comparison with similar homes in the area
Home Values in the Area
Average Home Value in this Area
Purchase History
| Date | Buyer | Sale Price | Title Company |
|---|---|---|---|
| Hill Dina M | -- | None Available | |
| Hill Alan R | -- | Fidelity National Title | |
| Hill Alan R | -- | First Southwestern Title Co | |
| Hill Alan R | -- | -- | |
| Garcia Carol Ann | -- | -- |
Source: Public Records
Mortgage History
| Date | Status | Borrower | Loan Amount |
|---|---|---|---|
| Open | Hill Alan R | $366,000 | |
| Closed | Hill Alan R | $123,750 |
Source: Public Records
Tax History
| Year | Tax Paid | Tax Assessment Tax Assessment Total Assessment is a certain percentage of the fair market value that is determined by local assessors to be the total taxable value of land and additions on the property. | Land | Improvement |
|---|---|---|---|---|
| 2025 | $3,701 | $266,240 | $125,404 | $140,836 |
| 2024 | $3,701 | $261,021 | $122,946 | $138,075 |
| 2023 | $3,648 | $255,904 | $120,536 | $135,368 |
| 2022 | $3,599 | $250,887 | $118,173 | $132,714 |
| 2021 | $3,542 | $245,968 | $115,856 | $130,112 |
| 2019 | $3,464 | $238,674 | $112,421 | $126,253 |
| 2018 | $3,211 | $233,995 | $110,217 | $123,778 |
| 2016 | $3,037 | $224,910 | $105,938 | $118,972 |
| 2015 | $2,955 | $221,532 | $104,347 | $117,185 |
| 2014 | $2,922 | $217,193 | $102,303 | $114,890 |
Source: Public Records
Map
Nearby Homes
- 16512 E Cypress St
- 4810 N Vincent Ave
- 4850 N Vincent Ave
- 16624 E Benwood St
- 1823 W Palm Dr
- 1811 David Ct
- 2131 W San Bernardino Rd Unit 46
- 2131 W San Bernardino Rd Unit 35
- 5136 N Saint Malo Ave
- 15228 Ramona Blvd
- 1231 W Eckerman Ave
- 5045 La Sena Ave
- 521 N Lark Ellen Ave Unit B
- 501 N Lark Ellen Ave Unit B
- 511 N Lark Ellen Ave Unit F
- 1081 W Arrow Hwy Unit 96
- 1081 W Arrow Hwy Unit 46
- 1191 E Laxford Rd
- 631 N La Sena Ave
- 17141 E Tudor St
- 16056 E Cypress St
- 16050 E Cypress St
- 4525 N Broadmoor Ave
- 16103 E Clovermead St
- 16060 E Cypress St
- 16044 E Cypress St
- 16104 E Cypress St
- 16040 E Cypress St
- 4512 N Shadydale Ave
- 16107 E Clovermead St
- 4521 N Broadmoor Ave
- 16036 E Cypress St
- 16108 E Cypress St
- 4506 N Shadydale Ave
- 16113 E Clovermead St
- 16030 E Cypress St
- 4517 N Broadmoor Ave
- 16116 E Cypress St
- 4536 N Irwindale Ave
- 4513 N Shadydale Ave
Your Personal Tour Guide
Ask me questions while you tour the home.