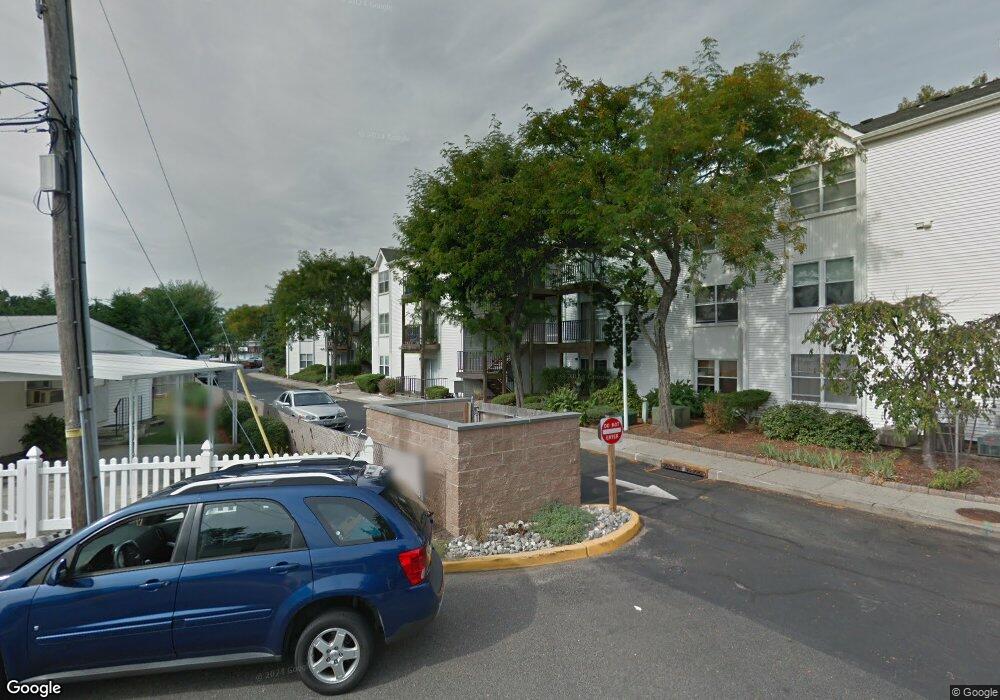
1606 Main St Belmar, NJ 07719
Estimated Value: $406,000 - $480,000
1
Bed
1
Bath
804
Sq Ft
$538/Sq Ft
Est. Value
About This Home
This home is located at 1606 Main St, Belmar, NJ 07719 and is currently estimated at $432,764, approximately $538 per square foot. 1606 Main St is a home located in Monmouth County with nearby schools including St. Rose Grammar School and St Rose High School.
Ownership History
Date
Name
Owned For
Owner Type
Purchase Details
Closed on
May 22, 2025
Sold by
Majmundar Biren N and Majmundar Sonal B
Bought by
Majmundar Biren N and Majmundar Sonal B
Current Estimated Value
Purchase Details
Closed on
Sep 23, 2021
Sold by
Mcloughlin Patricia
Bought by
Majmundar Biren
Home Financials for this Owner
Home Financials are based on the most recent Mortgage that was taken out on this home.
Original Mortgage
$248,250
Interest Rate
2.1%
Mortgage Type
New Conventional
Purchase Details
Closed on
Oct 30, 2003
Sold by
Sanchez Nicholas
Bought by
Mcloughlin Patricia
Home Financials for this Owner
Home Financials are based on the most recent Mortgage that was taken out on this home.
Original Mortgage
$140,000
Interest Rate
5.88%
Purchase Details
Closed on
Aug 22, 2001
Sold by
Zemo Eileen
Bought by
Hepting Jonah and Malone Kristi
Home Financials for this Owner
Home Financials are based on the most recent Mortgage that was taken out on this home.
Original Mortgage
$122,500
Interest Rate
7.05%
Mortgage Type
FHA
Create a Home Valuation Report for This Property
The Home Valuation Report is an in-depth analysis detailing your home's value as well as a comparison with similar homes in the area
Home Values in the Area
Average Home Value in this Area
Purchase History
| Date | Buyer | Sale Price | Title Company |
|---|---|---|---|
| Majmundar Biren N | -- | None Listed On Document | |
| Majmundar Biren N | -- | None Listed On Document | |
| Majmundar Biren | $339,000 | Rally Point Title Agency Llc | |
| Mcloughlin Patricia | $175,000 | -- | |
| Hepting Jonah | $125,000 | -- |
Source: Public Records
Mortgage History
| Date | Status | Borrower | Loan Amount |
|---|---|---|---|
| Previous Owner | Majmundar Biren | $248,250 | |
| Previous Owner | Mcloughlin Patricia | $140,000 | |
| Previous Owner | Hepting Jonah | $122,500 |
Source: Public Records
Tax History
| Year | Tax Paid | Tax Assessment Tax Assessment Total Assessment is a certain percentage of the fair market value that is determined by local assessors to be the total taxable value of land and additions on the property. | Land | Improvement |
|---|---|---|---|---|
| 2025 | $4,156 | $373,600 | $250,000 | $123,600 |
| 2024 | $4,005 | $372,100 | $250,000 | $122,100 |
| 2023 | $4,005 | $349,500 | $220,000 | $129,500 |
| 2022 | $3,445 | $301,000 | $180,000 | $121,000 |
| 2021 | $3,006 | $238,100 | $130,000 | $108,100 |
| 2020 | $3,006 | $210,800 | $110,000 | $100,800 |
| 2019 | $2,999 | $205,100 | $105,000 | $100,100 |
| 2018 | $3,058 | $196,400 | $100,000 | $96,400 |
| 2017 | $3,290 | $193,900 | $100,000 | $93,900 |
| 2016 | $3,297 | $186,900 | $95,000 | $91,900 |
| 2015 | $3,190 | $174,800 | $85,000 | $89,800 |
| 2014 | $2,904 | $170,800 | $65,000 | $105,800 |
Source: Public Records
Map
Nearby Homes
- 517 14th Ave
- 520 18th Ave
- 708 18th Ave
- 1809 Fernwood Rd
- 1812 Fernwood Rd Unit 2
- 1203 D St
- 823 13th Ave
- 503 11th Ave
- 1805 Margerum Ave
- 1850 Fernwood Rd
- 1200 H St
- 1000 River Rd Unit 7G
- 204 19th Ave
- 939 Woodland Ave
- 116 15th Ave
- 1209 16th Ave Unit 1
- 1209 16th Ave
- 113 12th Ave
- 1232 Pine Tree Way
- 107 18th Ave
- 1606 Main St Unit F305
- 1606 Main St Unit F301
- 1606 Main St Unit 2-03
- 1606 Main St Unit R108
- 1606 Main St Unit F101
- 1606 Main St
- 1606 Main St
- 1606 Main St
- 1606 Main St
- 1606 Main St
- 1606 Main St
- 1606 Main St
- 1606 Main St
- 1606 Main St
- 1606 Main St
- 1606 Main St Unit R207
- 1606 Main St
- 1606 Main St
- 1606 Main St
- 1606 Main St
Your Personal Tour Guide
Ask me questions while you tour the home.