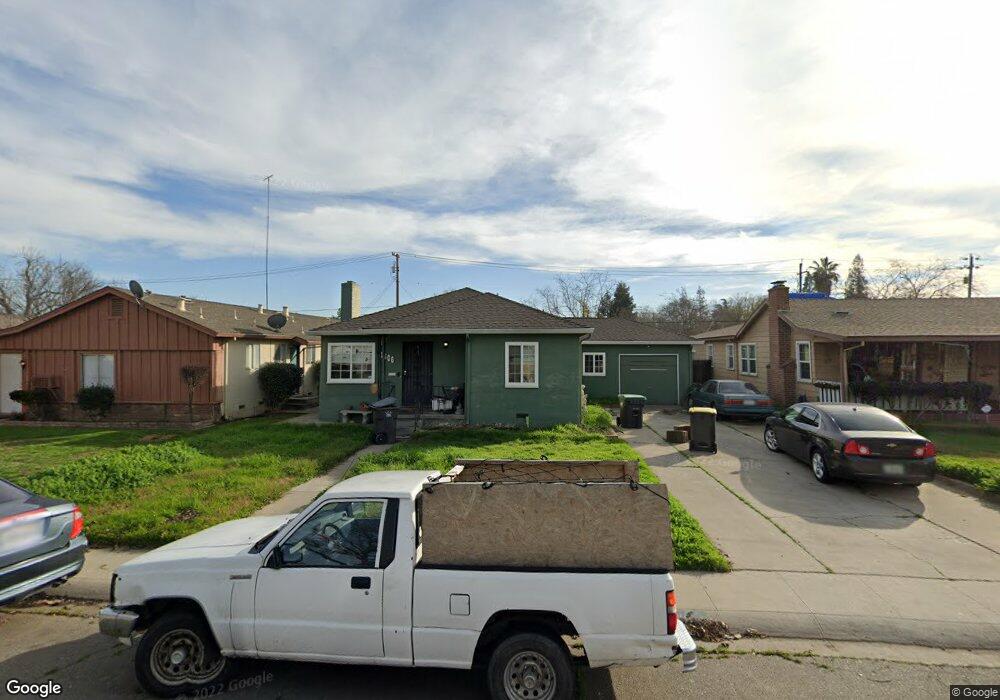
1606 Telegraph Ave Stockton, CA 95204
Country Club NeighborhoodEstimated Value: $318,000 - $352,000
2
Beds
1
Bath
1,082
Sq Ft
$308/Sq Ft
Est. Value
About This Home
This home is located at 1606 Telegraph Ave, Stockton, CA 95204 and is currently estimated at $333,299, approximately $308 per square foot. 1606 Telegraph Ave is a home located in San Joaquin County with nearby schools including Madison Elementary School, Hoover Elementary School, and Flora Arca Mata.
Ownership History
Date
Name
Owned For
Owner Type
Purchase Details
Closed on
Mar 4, 2014
Sold by
Tw Property Partnership
Bought by
Wu Chin Yun
Current Estimated Value
Purchase Details
Closed on
Oct 6, 2010
Sold by
Wu Chinyun Yang
Bought by
Tw Property Partnership
Purchase Details
Closed on
Feb 9, 2010
Sold by
Wu Yun Jung
Bought by
Wu Chinyun Yang
Purchase Details
Closed on
Feb 5, 2010
Sold by
U S Bank National Association
Bought by
Wu Chinyun Yang
Purchase Details
Closed on
Dec 1, 2009
Sold by
Gomez Anthony M and Gomez Claudia D
Bought by
U S Bank National Association
Purchase Details
Closed on
Nov 6, 2002
Sold by
Gomez Anthony M
Bought by
Gomez Anthony M and Gomez Claudia D
Home Financials for this Owner
Home Financials are based on the most recent Mortgage that was taken out on this home.
Original Mortgage
$136,000
Interest Rate
8.99%
Create a Home Valuation Report for This Property
The Home Valuation Report is an in-depth analysis detailing your home's value as well as a comparison with similar homes in the area
Home Values in the Area
Average Home Value in this Area
Purchase History
| Date | Buyer | Sale Price | Title Company |
|---|---|---|---|
| Wu Chin Yun | -- | None Available | |
| Tw Property Partnership | -- | None Available | |
| Wu Chinyun Yang | -- | Chicago Title Company | |
| Wu Chinyun Yang | $65,000 | Chicago Title Company | |
| U S Bank National Association | $64,604 | None Available | |
| Gomez Anthony M | -- | Fidelity Natl Title Ins Co |
Source: Public Records
Mortgage History
| Date | Status | Borrower | Loan Amount |
|---|---|---|---|
| Previous Owner | Gomez Anthony M | $136,000 |
Source: Public Records
Tax History Compared to Growth
Tax History
| Year | Tax Paid | Tax Assessment Tax Assessment Total Assessment is a certain percentage of the fair market value that is determined by local assessors to be the total taxable value of land and additions on the property. | Land | Improvement |
|---|---|---|---|---|
| 2025 | $1,883 | $134,837 | $49,031 | $85,806 |
| 2024 | $1,853 | $132,194 | $48,070 | $84,124 |
| 2023 | $1,815 | $129,603 | $47,128 | $82,475 |
| 2022 | $1,691 | $127,062 | $46,204 | $80,858 |
| 2021 | $1,635 | $124,572 | $45,299 | $79,273 |
| 2020 | $1,664 | $123,296 | $44,835 | $78,461 |
| 2019 | $1,658 | $120,879 | $43,956 | $76,923 |
| 2018 | $1,629 | $118,510 | $43,095 | $75,415 |
| 2017 | $1,549 | $116,187 | $42,250 | $73,937 |
| 2016 | $1,575 | $113,908 | $41,421 | $72,487 |
| 2014 | $983 | $68,444 | $16,848 | $51,596 |
Source: Public Records
Map
Nearby Homes
- 1533 Christina Ave
- 1517 Christina Ave
- 1516 Fog Bank Dr
- 1534 Cat Tail Dr
- 1618 Princeton Ave
- 3833 Stepping Stone Way
- 1420 Princeton Ave
- 3555 Grange Ave
- 1854 de Ovan Ave
- 3319 N Pershing Ave
- 4114 Crown Ave
- 4424 Ijams Lot 2 Rd
- 4424 Ijams Lot 3 Rd
- 1750 W Alpine Ave
- 1217 W Churchill St
- 1605 W Mendocino Ave
- 1944 La Jolla Dr
- 1526 W Monterey Ave
- 2036 La Jolla Dr
- 1812 W Monterey Ave
- 1614 Telegraph Ave
- 1624 Telegraph Ave
- 1630 Telegraph Ave
- 1605 Telegraph Ave
- 1613 Telegraph Ave
- 1541 Telegraph Ave
- 1619 Telegraph Ave
- 1625 Telegraph Ave
- 3606 Grange Ave
- 1640 Telegraph Ave
- 1631 Telegraph Ave
- 1612 Christina Ave
- 1620 Christina Ave
- 1604 Christina Ave
- 3540 Grange Ave
- 1628 Christina Ave
- 1542 Christina Ave
- 3622 Grange Ave
- 1636 Christina Ave
- 1534 Christina Ave