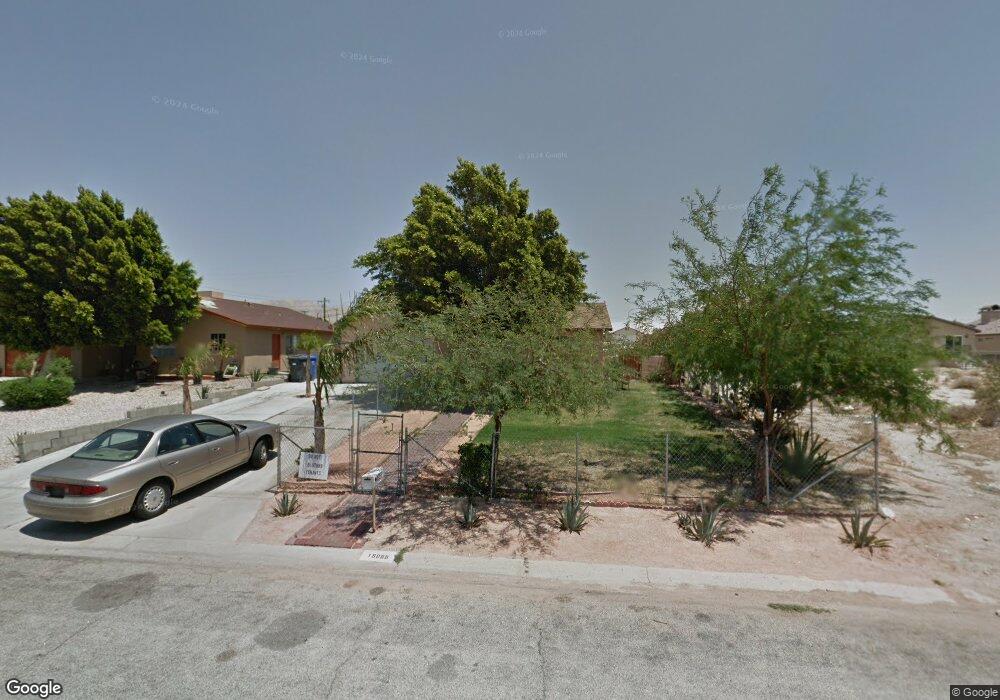
16066 Avenida Atezada Desert Hot Springs, CA 92240
Estimated Value: $255,000 - $373,000
3
Beds
2
Baths
1,100
Sq Ft
$284/Sq Ft
Est. Value
About This Home
This home is located at 16066 Avenida Atezada, Desert Hot Springs, CA 92240 and is currently estimated at $312,065, approximately $283 per square foot. 16066 Avenida Atezada is a home located in Riverside County with nearby schools including Bubbling Wells Elementary School, Desert Springs Middle School, and Desert Hot Springs High School.
Ownership History
Date
Name
Owned For
Owner Type
Purchase Details
Closed on
Apr 20, 2011
Sold by
U S Bank National Association and Washington Mutual Asset Backed Certifica
Bought by
Sherman Robert and Sherman Carole E
Current Estimated Value
Purchase Details
Closed on
Dec 21, 2010
Sold by
Chavez Graciela
Bought by
Bank Of America National Association
Purchase Details
Closed on
Jul 21, 2006
Sold by
Gastelum Jorge V and Chavez Graciela
Bought by
Chavez Graciela
Purchase Details
Closed on
Apr 23, 1996
Sold by
Gastelum Rafaela Quinonez
Bought by
Gastelum Jorge
Purchase Details
Closed on
Jan 24, 1996
Sold by
United States Of America
Bought by
Gasteum Jorge and Chavez Graciela
Purchase Details
Closed on
Jun 21, 1995
Sold by
Avila Juan A
Bought by
The Farmers Home Admin
Create a Home Valuation Report for This Property
The Home Valuation Report is an in-depth analysis detailing your home's value as well as a comparison with similar homes in the area
Home Values in the Area
Average Home Value in this Area
Purchase History
| Date | Buyer | Sale Price | Title Company |
|---|---|---|---|
| Sherman Robert | $45,000 | Ticor Title Company Of Ca | |
| Bank Of America National Association | $56,051 | Servicelink | |
| Chavez Graciela | -- | Fidelity National Title Co | |
| Gastelum Jorge | -- | Chicago Title Co | |
| Gasteum Jorge | -- | Chicago Title | |
| The Farmers Home Admin | $66,050 | Chicago Title Company |
Source: Public Records
Tax History Compared to Growth
Tax History
| Year | Tax Paid | Tax Assessment Tax Assessment Total Assessment is a certain percentage of the fair market value that is determined by local assessors to be the total taxable value of land and additions on the property. | Land | Improvement |
|---|---|---|---|---|
| 2025 | $705 | $57,633 | $8,636 | $48,997 |
| 2024 | $705 | $56,504 | $8,467 | $48,037 |
| 2023 | $705 | $55,397 | $8,301 | $47,096 |
| 2022 | $719 | $54,312 | $8,139 | $46,173 |
| 2021 | $705 | $53,248 | $7,980 | $45,268 |
| 2020 | $673 | $52,703 | $7,899 | $44,804 |
| 2019 | $661 | $51,671 | $7,745 | $43,926 |
| 2018 | $647 | $50,659 | $7,595 | $43,064 |
| 2017 | $636 | $49,667 | $7,447 | $42,220 |
| 2016 | $616 | $48,694 | $7,301 | $41,393 |
| 2015 | $590 | $47,965 | $7,193 | $40,772 |
| 2014 | $586 | $47,027 | $7,053 | $39,974 |
Source: Public Records
Map
Nearby Homes
- 15900 Avenida Atezada
- 16094 Avenida Atezada
- 16295 Avenida Atezada
- 16240 Avenida Rambla
- 16347 Avenue Atezada
- 15515 Bubbling Wells Rd
- 15483 Avenida Atezada
- 0 Avenida Garcia
- 0 Avenida Atezada Unit 219128335DA
- 15435 Avenida Merced
- 15315 Avenida Mirola
- 16400 Bubbling Wells Rd Unit 176
- 16400 Bubbling Wells Rd Unit 105
- 16400 Bubbling Wells Rd Unit 69
- 16400 Bubbling Wells Rd Unit 180
- 15707 Avenue Manzana
- 0 Avenida Mirola Unit NP25135522
- 15500 Bubbling Wells Rd Unit 84
- 15500 Bubbling Wells Rd Unit 25
- 15500 Bubbling Wells Rd Unit 277
- 16078 Avenida Atezada
- 16030 Avenida Atezada
- 16065 Avenida Rambla
- 16045 Avenida Rambla
- 16105 Avenida Rambla
- 17 Avenida Atezada
- 16 Avenida Atezada
- 2 Avenue Atezada
- 4 Avenue Atezada
- 16067 Avenida Atezada
- 16079 Avenida Atezada
- 16095 Avenida Atezada
- 67420 Camino Aventura
- 16095 Avenida Atazada
- 16095 Avenue Atezada
- 16125 Avenida Rambla
- 16142 Avenida Atezada
- 17 Avenue Rambla
- 18 Avenue Rambla
- 0 Avenue Rambla