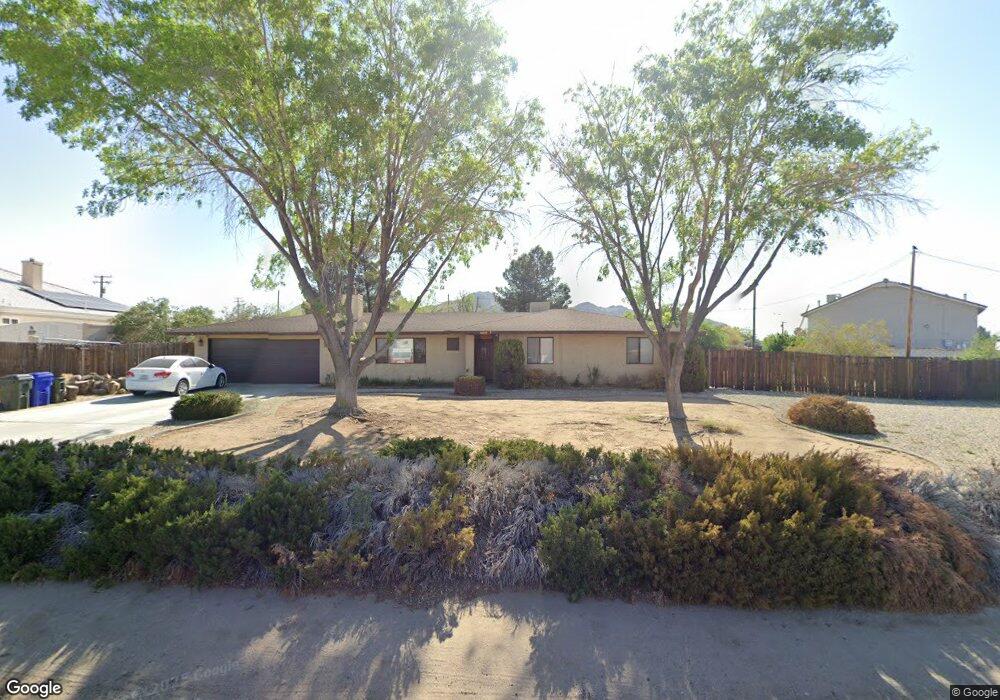
16069 Kasson Rd Apple Valley, CA 92307
High Desert NeighborhoodEstimated Value: $434,000 - $510,000
4
Beds
2
Baths
1,805
Sq Ft
$256/Sq Ft
Est. Value
About This Home
This home is located at 16069 Kasson Rd, Apple Valley, CA 92307 and is currently estimated at $462,850, approximately $256 per square foot. 16069 Kasson Rd is a home located in San Bernardino County with nearby schools including Desert Knolls Elementary School, Granite Hills High School, and Academy for Academic Excellence.
Ownership History
Date
Name
Owned For
Owner Type
Purchase Details
Closed on
Feb 4, 2005
Sold by
Grill Kate N Harper
Bought by
Grill Matthew L
Current Estimated Value
Purchase Details
Closed on
Jan 21, 2004
Sold by
Cunningham Robert H
Bought by
Cliff Peters Inc
Purchase Details
Closed on
Jun 7, 1996
Sold by
Hud
Bought by
Riley Patrick E and Riley Bonnie B
Home Financials for this Owner
Home Financials are based on the most recent Mortgage that was taken out on this home.
Original Mortgage
$79,081
Interest Rate
8.09%
Mortgage Type
FHA
Purchase Details
Closed on
Oct 30, 1995
Sold by
Leader Federal Bank For Svgs
Bought by
Hud
Purchase Details
Closed on
Oct 23, 1995
Sold by
Smith Edward
Bought by
Leader Federal Bank For Svgs
Purchase Details
Closed on
Feb 23, 1995
Sold by
Cunningham Robert and Mishkin Harold
Bought by
Cunningham Robert H and Mishkin Harold
Create a Home Valuation Report for This Property
The Home Valuation Report is an in-depth analysis detailing your home's value as well as a comparison with similar homes in the area
Home Values in the Area
Average Home Value in this Area
Purchase History
| Date | Buyer | Sale Price | Title Company |
|---|---|---|---|
| Grill Matthew L | -- | First American | |
| Cliff Peters Inc | $65,000 | Chicago Title Co | |
| Riley Patrick E | $80,000 | First American Title Ins Co | |
| Hud | -- | Fidelity National Title Ins | |
| Leader Federal Bank For Svgs | $127,204 | Fidelity National Title Ins | |
| Cunningham Robert H | -- | -- |
Source: Public Records
Mortgage History
| Date | Status | Borrower | Loan Amount |
|---|---|---|---|
| Previous Owner | Riley Patrick E | $79,081 |
Source: Public Records
Tax History Compared to Growth
Tax History
| Year | Tax Paid | Tax Assessment Tax Assessment Total Assessment is a certain percentage of the fair market value that is determined by local assessors to be the total taxable value of land and additions on the property. | Land | Improvement |
|---|---|---|---|---|
| 2025 | $1,722 | $151,606 | $24,431 | $127,175 |
| 2024 | $1,722 | $148,633 | $23,952 | $124,681 |
| 2023 | $1,704 | $145,718 | $23,482 | $122,236 |
| 2022 | $1,677 | $142,861 | $23,022 | $119,839 |
| 2021 | $1,637 | $140,060 | $22,571 | $117,489 |
| 2020 | $1,616 | $138,624 | $22,340 | $116,284 |
| 2019 | $1,585 | $135,906 | $21,902 | $114,004 |
| 2018 | $1,545 | $133,242 | $21,473 | $111,769 |
| 2017 | $1,522 | $130,629 | $21,052 | $109,577 |
| 2016 | $1,437 | $128,067 | $20,639 | $107,428 |
| 2015 | $1,414 | $126,143 | $20,329 | $105,814 |
| 2014 | $1,394 | $123,672 | $19,931 | $103,741 |
Source: Public Records
Map
Nearby Homes
- 18965 Siskiyou Rd
- 15908 Acoma Rd
- 19171 Carlisle Rd
- 0 Allegheny Rd Unit SB19127526
- 19170 California 18
- 18765 Munsee Rd
- 16161 Saint Timothy Rd
- 16270 Chippewa Rd
- 19385 Saint Timothy Ct
- 18924 Symeron Rd
- 19375 Corwin Rd
- 16027 Mandan Rd
- 18830 Munsee Rd
- 16392 Monache Rd
- 16485 Wintun Rd
- 0 Tao Rd Unit CV23214930
- 0 Roanoke Rd Unit HD25142103
- 0 Roanoke Rd Unit HD24221276
- 16158 Rimrock Rd
- 19030 Lenca Rd
- 16087 Kasson Rd
- 16039 Kasson Rd
- 16070 Kasson Rd
- 16088 Kasson Rd
- 16105 Kasson Rd
- 16018 Venango Rd
- 16040 Kasson Rd
- 19038 Resoto Rd
- 16015 Venango Rd
- 16110 Kasson Rd
- 16125 Kasson Rd
- 16024 Venango Rd
- 18930 Resoto Rd
- 15990 Venango Rd
- 16021 Venango Rd
- 16037 Tao Rd
- 18963 Resoto Rd
- 123 Roanoke Rd
- 16098 Tao Rd
- 19015 Corwin Rd