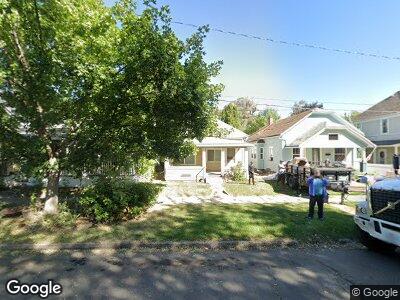
1607 5th St La Grande, OR 97850
Estimated Value: $159,000 - $187,745
2
Beds
1
Bath
1,584
Sq Ft
$109/Sq Ft
Est. Value
About This Home
This home is located at 1607 5th St, La Grande, OR 97850 and is currently estimated at $173,373, approximately $109 per square foot. 1607 5th St is a home located in Union County with nearby schools including La Grande High School, The Marian Academy, and Grande Ronde Academy.
Ownership History
Date
Name
Owned For
Owner Type
Purchase Details
Closed on
Dec 29, 2015
Sold by
Breuner Jay John and Breuner Michele S
Bought by
Goodman Anna
Current Estimated Value
Home Financials for this Owner
Home Financials are based on the most recent Mortgage that was taken out on this home.
Original Mortgage
$52,000
Interest Rate
3.94%
Mortgage Type
Purchase Money Mortgage
Purchase Details
Closed on
Apr 10, 2013
Sold by
Breuner Jay J and Breuner Michele S
Bought by
Breuner Jay John and Breuner Michele S
Create a Home Valuation Report for This Property
The Home Valuation Report is an in-depth analysis detailing your home's value as well as a comparison with similar homes in the area
Home Values in the Area
Average Home Value in this Area
Purchase History
| Date | Buyer | Sale Price | Title Company |
|---|---|---|---|
| Goodman Anna | $65,000 | Eastern Oregon Title Inc | |
| Breuner Jay John | -- | None Available |
Source: Public Records
Mortgage History
| Date | Status | Borrower | Loan Amount |
|---|---|---|---|
| Open | Goodman Anna | $141,000 | |
| Closed | Goodman Anna | $52,000 |
Source: Public Records
Tax History Compared to Growth
Tax History
| Year | Tax Paid | Tax Assessment Tax Assessment Total Assessment is a certain percentage of the fair market value that is determined by local assessors to be the total taxable value of land and additions on the property. | Land | Improvement |
|---|---|---|---|---|
| 2024 | $1,235 | $68,600 | $34,030 | $34,570 |
| 2023 | $1,213 | $66,610 | $33,040 | $33,570 |
| 2022 | $1,181 | $64,675 | $32,082 | $32,593 |
| 2021 | $1,151 | $62,792 | $31,416 | $31,376 |
| 2020 | $1,105 | $60,964 | $30,520 | $30,444 |
| 2019 | $1,082 | $59,189 | $29,723 | $29,466 |
| 2018 | $1,053 | $57,466 | $29,087 | $28,379 |
| 2017 | $1,023 | $55,793 | $28,457 | $27,336 |
| 2016 | $992 | $54,168 | $27,702 | $26,466 |
| 2015 | $957 | $52,591 | $26,935 | $25,656 |
| 2014 | $831 | $51,060 | $26,208 | $24,852 |
| 2013 | -- | $49,573 | $25,427 | $24,146 |
Source: Public Records
Map
Nearby Homes