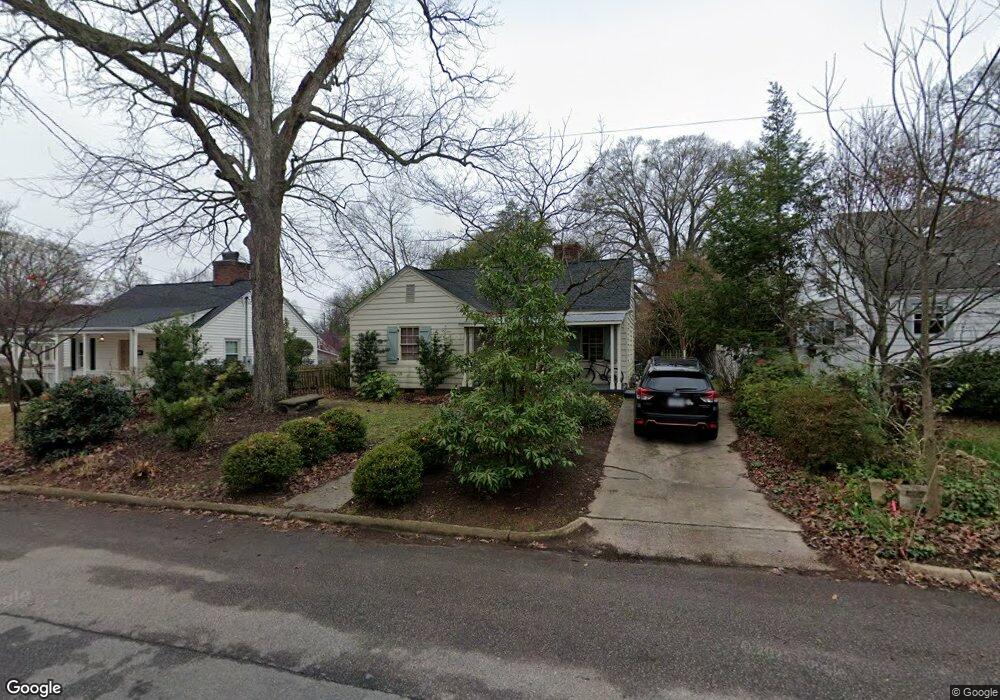
1607 Carson St Raleigh, NC 27608
Five Points NeighborhoodEstimated Value: $553,185 - $615,000
2
Beds
1
Bath
901
Sq Ft
$634/Sq Ft
Est. Value
About This Home
This home is located at 1607 Carson St, Raleigh, NC 27608 and is currently estimated at $571,046, approximately $633 per square foot. 1607 Carson St is a home located in Wake County with nearby schools including Underwood Magnet Elementary School, Oberlin Middle School, and Broughton Magnet High School.
Ownership History
Date
Name
Owned For
Owner Type
Purchase Details
Closed on
May 23, 2016
Sold by
Guice Cameron Charles
Bought by
Adamo Partners Llc
Current Estimated Value
Purchase Details
Closed on
May 29, 2009
Sold by
Lemanski Joseph R and Lemanski Jerri Lynn
Bought by
Guice Cameron Charles
Home Financials for this Owner
Home Financials are based on the most recent Mortgage that was taken out on this home.
Original Mortgage
$186,400
Interest Rate
4.81%
Mortgage Type
Purchase Money Mortgage
Purchase Details
Closed on
Feb 28, 2002
Sold by
Smith Mary N
Bought by
Lemanski Joseph R
Home Financials for this Owner
Home Financials are based on the most recent Mortgage that was taken out on this home.
Original Mortgage
$110,400
Interest Rate
5.75%
Create a Home Valuation Report for This Property
The Home Valuation Report is an in-depth analysis detailing your home's value as well as a comparison with similar homes in the area
Home Values in the Area
Average Home Value in this Area
Purchase History
| Date | Buyer | Sale Price | Title Company |
|---|---|---|---|
| Adamo Partners Llc | $309,000 | None Available | |
| Guice Cameron Charles | $233,000 | None Available | |
| Lemanski Joseph R | $138,000 | -- |
Source: Public Records
Mortgage History
| Date | Status | Borrower | Loan Amount |
|---|---|---|---|
| Previous Owner | Guice Cameron Charles | $186,400 | |
| Previous Owner | Lemanski Joseph R | $110,400 | |
| Closed | Lemanski Joseph R | $13,800 |
Source: Public Records
Tax History
| Year | Tax Paid | Tax Assessment Tax Assessment Total Assessment is a certain percentage of the fair market value that is determined by local assessors to be the total taxable value of land and additions on the property. | Land | Improvement |
|---|---|---|---|---|
| 2025 | $4,681 | $534,433 | $503,500 | $30,933 |
| 2024 | $4,662 | $534,433 | $503,500 | $30,933 |
Source: Public Records
Map
Nearby Homes
- 1614 Carson St
- 202 Georgetown Rd
- 204 Georgetown Rd
- 518 E Whitaker Mill Rd
- 1601 Sunrise Ave
- 1913 Reaves Dr
- 214 Hudson St
- 1704 Center Rd
- 1610 Draper View Loop Unit 101
- 401 Bryan Pointe Dr Unit 103
- 1523 Sunrise Ave
- 1521 1/2 Sunrise Ave
- 1521 Havenmont Ct
- 1704 Bickett Blvd
- 1521 Sunrise Ave
- 1527 Urban Trace Ln
- 1525 Urban Trace Ln
- 1523 Havenmont Ct
- 1525 Havenmont Ct
- 1523 Urban Trace Ln
- 1605 Carson St
- 1609 Carson St
- 122 Georgetown Rd
- 1603 Carson St
- 120 Georgetown Rd
- 325 Pershing Rd
- 323 Pershing Rd
- 1608 Carson St
- 1601 Carson St
- 1800 Reaves Dr
- 116 Georgetown Rd
- 127 Georgetown Rd
- 123 Georgetown Rd
- 1606 Carson St
- 201 Georgetown Rd
- 1700 Carson St
- 1802 Reaves Dr
- 1600 Carson St
- 1604 Carson St
- 114 Georgetown Rd
Your Personal Tour Guide
Ask me questions while you tour the home.