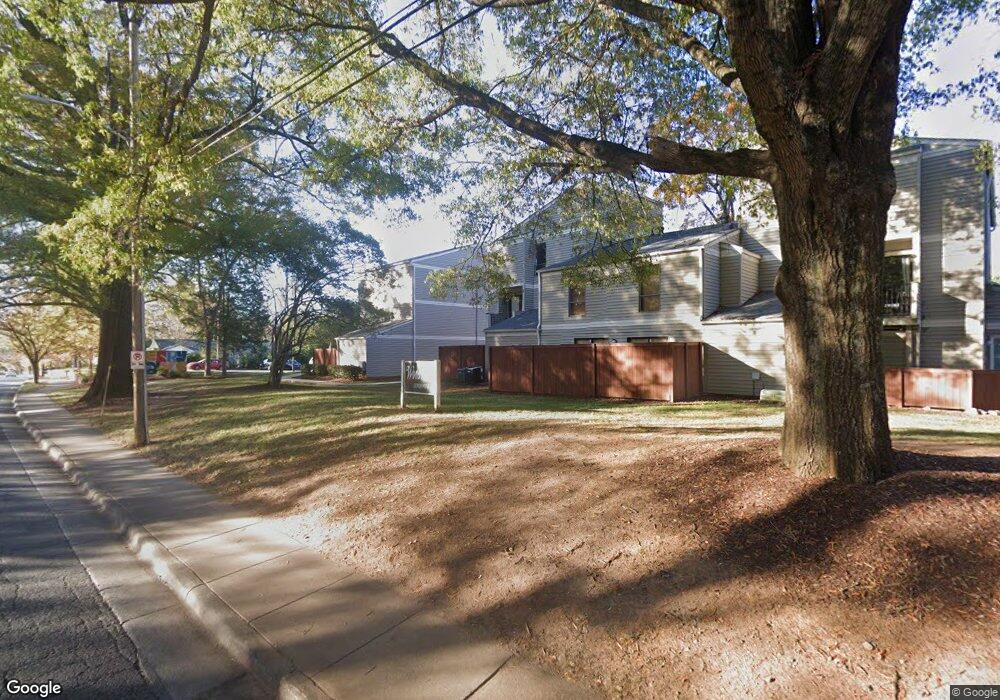
1607 Merry Oaks Rd Unit F Charlotte, NC 28205
Country Club Heights NeighborhoodEstimated Value: $237,923 - $248,000
2
Beds
2
Baths
1,058
Sq Ft
$230/Sq Ft
Est. Value
About This Home
This home is located at 1607 Merry Oaks Rd Unit F, Charlotte, NC 28205 and is currently estimated at $243,231, approximately $229 per square foot. 1607 Merry Oaks Rd Unit F is a home located in Mecklenburg County with nearby schools including Merry Oaks International Academy Elementary, Eastway Middle School, and Garinger High School.
Ownership History
Date
Name
Owned For
Owner Type
Purchase Details
Closed on
Jan 16, 2013
Sold by
Federal National Mortgage Association
Bought by
Koehler Sylvia L
Current Estimated Value
Purchase Details
Closed on
Dec 20, 2012
Sold by
Araque Jorge A
Bought by
Federal Natiional Mortgage Assn and Fannie Mae
Purchase Details
Closed on
May 11, 2006
Sold by
Torres Allen
Bought by
Araque Jorge A
Home Financials for this Owner
Home Financials are based on the most recent Mortgage that was taken out on this home.
Original Mortgage
$52,000
Interest Rate
6.33%
Mortgage Type
Fannie Mae Freddie Mac
Purchase Details
Closed on
Sep 29, 1999
Sold by
Carol Grady Annie
Bought by
Torres Allen
Home Financials for this Owner
Home Financials are based on the most recent Mortgage that was taken out on this home.
Original Mortgage
$43,700
Interest Rate
7.89%
Mortgage Type
Purchase Money Mortgage
Create a Home Valuation Report for This Property
The Home Valuation Report is an in-depth analysis detailing your home's value as well as a comparison with similar homes in the area
Home Values in the Area
Average Home Value in this Area
Purchase History
| Date | Buyer | Sale Price | Title Company |
|---|---|---|---|
| Koehler Sylvia L | -- | None Available | |
| Federal Natiional Mortgage Assn | $52,328 | None Available | |
| Araque Jorge A | $65,000 | None Available | |
| Torres Allen | $46,000 | -- |
Source: Public Records
Mortgage History
| Date | Status | Borrower | Loan Amount |
|---|---|---|---|
| Previous Owner | Araque Jorge A | $52,000 | |
| Previous Owner | Torres Allen | $43,700 |
Source: Public Records
Tax History Compared to Growth
Tax History
| Year | Tax Paid | Tax Assessment Tax Assessment Total Assessment is a certain percentage of the fair market value that is determined by local assessors to be the total taxable value of land and additions on the property. | Land | Improvement |
|---|---|---|---|---|
| 2025 | $1,721 | $206,974 | -- | $206,974 |
| 2024 | $1,721 | $206,974 | -- | $206,974 |
| 2023 | $1,029 | $206,974 | $0 | $206,974 |
| 2022 | $647 | $54,000 | $0 | $54,000 |
| 2021 | $636 | $54,000 | $0 | $54,000 |
| 2020 | $521 | $54,000 | $0 | $54,000 |
| 2019 | $613 | $54,000 | $0 | $54,000 |
| 2018 | $732 | $50,200 | $16,500 | $33,700 |
| 2017 | $713 | $50,200 | $16,500 | $33,700 |
| 2016 | $703 | $50,200 | $16,500 | $33,700 |
| 2015 | $692 | $50,200 | $16,500 | $33,700 |
| 2014 | $684 | $50,200 | $16,500 | $33,700 |
Source: Public Records
Map
Nearby Homes
- 1635 Merry Oaks Rd
- 1635 Merry Oaks Rd Unit C
- 1533 Briar Creek Rd Unit A
- 1543 Briar Creek Rd Unit B
- 1519 Briar Creek Rd Unit B
- 3329 Draper Ave
- 1424 Wembley Dr
- 1412 Wembley Dr
- 3500 Draper Ave
- 1400 Briar Creek Rd
- 1324 Carolyn Dr
- 1646 Arnold Dr
- 1345 Pinecrest Ave
- 1321 Pinecrest Ave
- 1460 Medford Dr
- 2528 Arnold Dr
- 2538 Arnold Dr
- 1955 Arnold Dr
- 3337 Eastway Dr
- 2601 Eastway Dr
- 1607 Merry Oaks Rd Unit G
- 1607 Merry Oaks Rd Unit E
- 1607 Merry Oaks Rd Unit D
- 1607 Merry Oaks Rd Unit C
- 1607 Merry Oaks Rd Unit B
- 1607 Merry Oaks Rd Unit A
- 1616 Flynwood Dr Unit G
- 1616 Flynwood Dr Unit F
- 1616 Flynwood Dr Unit E
- 1616 Flynwood Dr Unit D
- 1616 Flynwood Dr Unit C
- 1616 Flynwood Dr Unit B
- 1616 Flynwood Dr Unit A
- 1616 Flynwood Dr
- 1615 Merry Oaks Rd
- 1615 Merry Oaks Rd Unit F
- 1615 Merry Oaks Rd Unit E
- 1615 Merry Oaks Rd Unit D
- 1615 Merry Oaks Rd Unit C
- 1615 Merry Oaks Rd Unit B