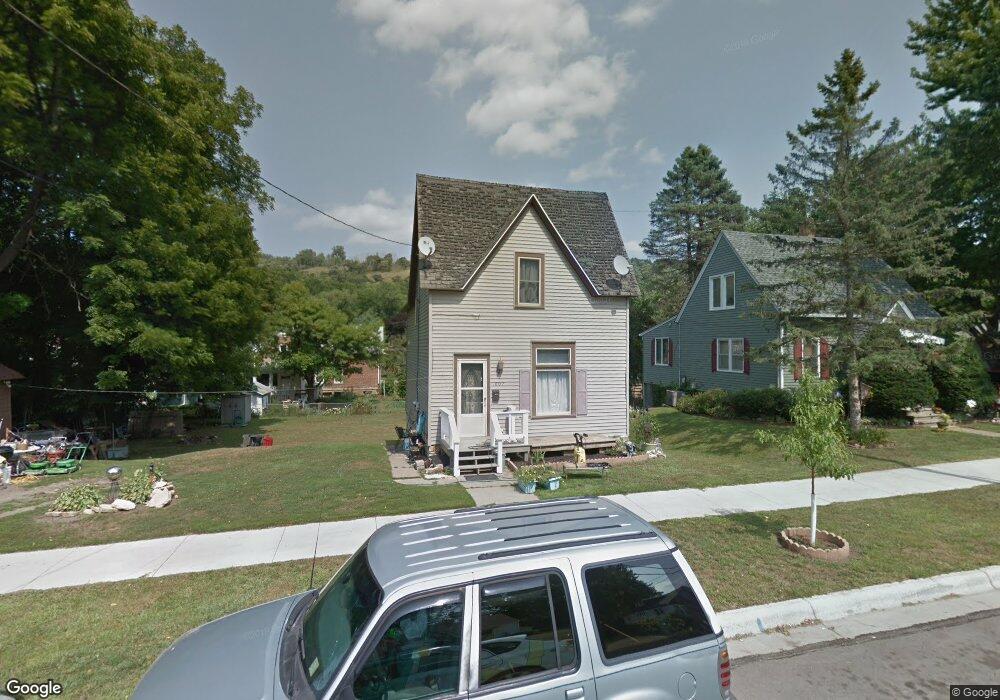
1607 S Park St Red Wing, MN 55066
Estimated Value: $149,000 - $278,000
3
Beds
2
Baths
1,272
Sq Ft
$170/Sq Ft
Est. Value
About This Home
This home is located at 1607 S Park St, Red Wing, MN 55066 and is currently estimated at $216,702, approximately $170 per square foot. 1607 S Park St is a home located in Goodhue County with nearby schools including Sunnyside Elementary School, Burnside Elementary School, and Twin Bluff Middle School.
Ownership History
Date
Name
Owned For
Owner Type
Purchase Details
Closed on
Feb 6, 2020
Sold by
Betcher Lloyd Leroy Est
Bought by
Savage Heidi J
Current Estimated Value
Purchase Details
Closed on
May 5, 2009
Sold by
Deutsch Bank National Trust Co
Bought by
Betcher Lloyd and Setcher Carol
Purchase Details
Closed on
Jun 24, 2005
Sold by
Weiland Paul L
Bought by
Raebel Shelly
Purchase Details
Closed on
Jan 19, 2001
Sold by
Church Of St Joseph Of Red Wing Minnesot
Bought by
Weiland Paul I and Weiland Alvina
Create a Home Valuation Report for This Property
The Home Valuation Report is an in-depth analysis detailing your home's value as well as a comparison with similar homes in the area
Home Values in the Area
Average Home Value in this Area
Purchase History
| Date | Buyer | Sale Price | Title Company |
|---|---|---|---|
| Savage Heidi J | -- | None Available | |
| Betcher Lloyd | $31,000 | -- | |
| Raebel Shelly | $115,500 | -- | |
| Weiland Paul I | $20,000 | -- |
Source: Public Records
Tax History Compared to Growth
Tax History
| Year | Tax Paid | Tax Assessment Tax Assessment Total Assessment is a certain percentage of the fair market value that is determined by local assessors to be the total taxable value of land and additions on the property. | Land | Improvement |
|---|---|---|---|---|
| 2025 | $2,756 | $106,500 | $43,700 | $62,800 |
| 2024 | -- | $105,300 | $43,700 | $61,600 |
| 2023 | $1,432 | $101,200 | $43,700 | $57,500 |
| 2022 | $1,392 | $100,700 | $43,700 | $57,000 |
| 2021 | $1,348 | $90,500 | $43,700 | $46,800 |
| 2020 | $1,466 | $86,900 | $43,700 | $43,200 |
| 2019 | $1,448 | $88,700 | $43,700 | $45,000 |
| 2018 | $1,530 | $87,200 | $42,000 | $45,200 |
| 2017 | $758 | $80,000 | $42,000 | $38,000 |
| 2016 | $728 | $66,400 | $42,000 | $24,400 |
| 2015 | $732 | $65,300 | $42,000 | $23,300 |
| 2014 | -- | $64,000 | $42,000 | $22,000 |
Source: Public Records
Map
Nearby Homes