1607 W Classical Blvd Delray Beach, FL 33445
High Point NeighborhoodEstimated Value: $777,000 - $831,000
5
Beds
3
Baths
2,977
Sq Ft
$270/Sq Ft
Est. Value
About This Home
This home is located at 1607 W Classical Blvd, Delray Beach, FL 33445 and is currently estimated at $804,641, approximately $270 per square foot. 1607 W Classical Blvd is a home located in Palm Beach County with nearby schools including Banyan Creek Elementary School, Carver Community Middle School, and Atlantic High School.
Ownership History
Date
Name
Owned For
Owner Type
Purchase Details
Closed on
Oct 29, 2024
Sold by
Shore Kathleen S
Bought by
Shore Kathleen S and Shore-Matthews Shanna E
Current Estimated Value
Purchase Details
Closed on
Aug 28, 2012
Sold by
Shore Kathleen S and Shore Michael P
Bought by
Shore Kathlee S and Shore Michael P
Home Financials for this Owner
Home Financials are based on the most recent Mortgage that was taken out on this home.
Original Mortgage
$547,500
Interest Rate
3.53%
Mortgage Type
Reverse Mortgage Home Equity Conversion Mortgage
Purchase Details
Closed on
Aug 21, 2007
Sold by
Shore Michael P
Bought by
Shore Kathleen S
Purchase Details
Closed on
Apr 18, 2003
Sold by
Colony Of Palm Beach Llc
Bought by
Shore Michael P and Shore Kathleen S
Home Financials for this Owner
Home Financials are based on the most recent Mortgage that was taken out on this home.
Original Mortgage
$175,000
Interest Rate
3.75%
Create a Home Valuation Report for This Property
The Home Valuation Report is an in-depth analysis detailing your home's value as well as a comparison with similar homes in the area
Home Values in the Area
Average Home Value in this Area
Purchase History
| Date | Buyer | Sale Price | Title Company |
|---|---|---|---|
| Shore Kathleen S | -- | None Listed On Document | |
| Shore Kathlee S | $24,977 | Action Title Company | |
| Shore Kathleen S | -- | None Available | |
| Shore Michael P | $229,900 | -- |
Source: Public Records
Mortgage History
| Date | Status | Borrower | Loan Amount |
|---|---|---|---|
| Previous Owner | Shore Kathlee S | $547,500 | |
| Previous Owner | Shore Michael P | $175,000 |
Source: Public Records
Tax History
| Year | Tax Paid | Tax Assessment Tax Assessment Total Assessment is a certain percentage of the fair market value that is determined by local assessors to be the total taxable value of land and additions on the property. | Land | Improvement |
|---|---|---|---|---|
| 2025 | $6,092 | $369,356 | -- | -- |
| 2024 | $6,092 | $358,947 | -- | -- |
| 2023 | $6,106 | $348,492 | $0 | $0 |
| 2022 | $6,034 | $338,342 | $0 | $0 |
| 2021 | $6,040 | $328,487 | $0 | $0 |
| 2020 | $5,996 | $323,952 | $0 | $0 |
| 2019 | $5,914 | $316,669 | $0 | $0 |
| 2018 | $5,663 | $310,764 | $0 | $0 |
| 2017 | $5,638 | $304,372 | $0 | $0 |
| 2016 | $5,672 | $298,112 | $0 | $0 |
| 2015 | $5,818 | $296,040 | $0 | $0 |
| 2014 | $5,855 | $293,690 | $0 | $0 |
Source: Public Records
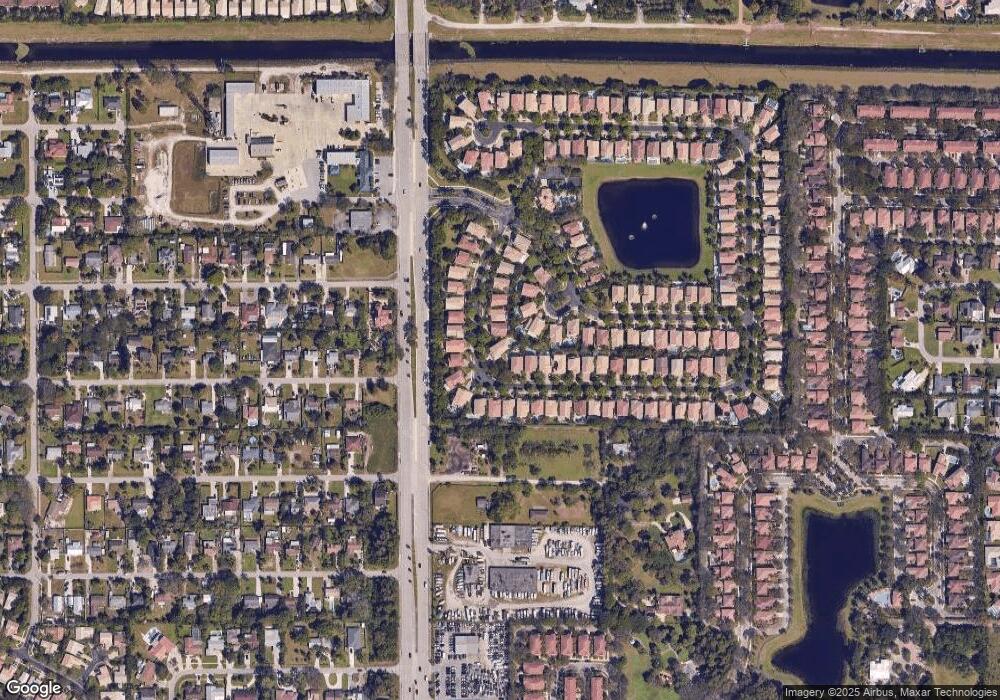
Map
Nearby Homes
- 4795 S Classical Blvd
- 4838 Charlton Way
- 1605 E Classical Blvd
- 1518 Fenton Dr
- 1428 W Wickham Cir Unit A
- 13026 Hampton Lakes Cir
- 13055 Hampton Lakes Cir
- 632 Hummingbird Ln
- 12958 Hampton Lakes Cir
- 635 Hummingbird Ln
- 5285 Sunrise Blvd
- 634 Hummingbird Ln Unit 6340
- 12937 Cocoa Pine Dr
- 521 Sandpiper Cir
- 5122 Marla Dr
- 4533 Danson Way
- 604 Hummingbird Ln Unit 6040
- 5696 Spacious Skies Way
- 5726 Graceful Way
- 5181 Magellan Way W
- 1617 W Blvd
- 1617 W Classical Blvd
- 4849 S Classical Blvd
- 1623 W Classical Blvd
- 4843 S Classical Blvd
- 4838 4838 S Modern Dr
- 4838 Modern Dr
- # S Classical Blvd
- 1612 W Classical Blvd
- 1618 W Classical Blvd
- 4844 Modern Dr
- 1633 W Classical Blvd
- 4837 S Classical Blvd
- 4832 Modern Dr
- 1600 W Classical Blvd
- 4858 S Classical Blvd
- 4852 S Classical Blvd
- 1630 W Classical Blvd
- 4831 S Classical Blvd
Your Personal Tour Guide
Ask me questions while you tour the home.