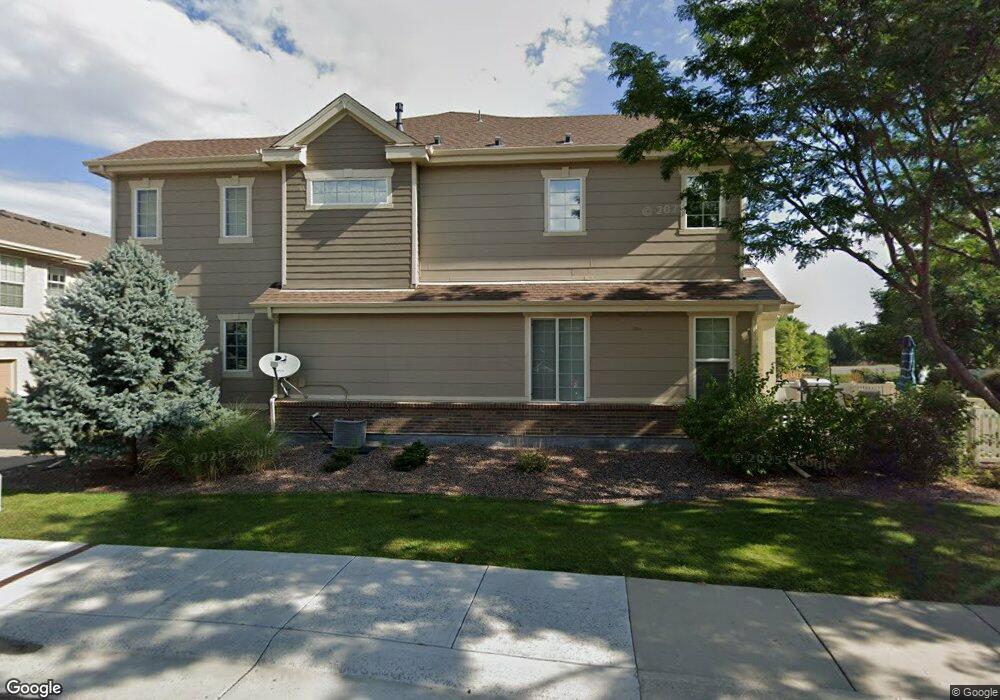
16071 W 63rd Ln Unit A Arvada, CO 80403
Estimated Value: $481,252 - $547,000
3
Beds
3
Baths
1,593
Sq Ft
$329/Sq Ft
Est. Value
About This Home
This home is located at 16071 W 63rd Ln Unit A, Arvada, CO 80403 and is currently estimated at $524,813, approximately $329 per square foot. 16071 W 63rd Ln Unit A is a home located in Jefferson County with nearby schools including Fairmount Elementary School, Drake Junior High School, and Arvada West High School.
Ownership History
Date
Name
Owned For
Owner Type
Purchase Details
Closed on
Jun 15, 2015
Sold by
Kelley James J and Kelley Clifford
Bought by
Sweetser Adam and Bruce Anna D
Current Estimated Value
Home Financials for this Owner
Home Financials are based on the most recent Mortgage that was taken out on this home.
Original Mortgage
$270,500
Outstanding Balance
$209,135
Interest Rate
3.7%
Mortgage Type
New Conventional
Estimated Equity
$315,678
Purchase Details
Closed on
Apr 25, 2014
Sold by
Kunz Magan M
Bought by
Kelley James J and Kelley Clifford
Home Financials for this Owner
Home Financials are based on the most recent Mortgage that was taken out on this home.
Original Mortgage
$219,600
Interest Rate
4.36%
Mortgage Type
New Conventional
Purchase Details
Closed on
Jul 31, 2012
Sold by
Enclave At Boyd Ponds Llc
Bought by
Sannino John M and Fore Mary Ann
Create a Home Valuation Report for This Property
The Home Valuation Report is an in-depth analysis detailing your home's value as well as a comparison with similar homes in the area
Home Values in the Area
Average Home Value in this Area
Purchase History
| Date | Buyer | Sale Price | Title Company |
|---|---|---|---|
| Sweetser Adam | $320,500 | Heritage Title | |
| Kelley James J | $274,500 | Stewart Title | |
| Sannino John M | $241,429 | First American |
Source: Public Records
Mortgage History
| Date | Status | Borrower | Loan Amount |
|---|---|---|---|
| Open | Sweetser Adam | $270,500 | |
| Previous Owner | Kelley James J | $219,600 |
Source: Public Records
Tax History Compared to Growth
Tax History
| Year | Tax Paid | Tax Assessment Tax Assessment Total Assessment is a certain percentage of the fair market value that is determined by local assessors to be the total taxable value of land and additions on the property. | Land | Improvement |
|---|---|---|---|---|
| 2024 | $3,754 | $30,383 | $6,030 | $24,353 |
| 2023 | $3,754 | $30,383 | $6,030 | $24,353 |
| 2022 | $3,132 | $23,382 | $4,170 | $19,212 |
| 2021 | $3,242 | $24,055 | $4,290 | $19,765 |
| 2020 | $3,278 | $24,375 | $4,290 | $20,085 |
| 2019 | $3,247 | $24,375 | $4,290 | $20,085 |
| 2018 | $3,240 | $23,837 | $3,600 | $20,237 |
| 2017 | $3,310 | $23,837 | $3,600 | $20,237 |
| 2016 | $3,081 | $21,986 | $4,776 | $17,210 |
| 2015 | $2,553 | $21,986 | $4,776 | $17,210 |
| 2014 | $2,553 | $17,456 | $2,229 | $15,227 |
Source: Public Records
Map
Nearby Homes
- 15952 W 63rd Ln Unit A
- 6268 Pike Ct Unit D
- 16019 W 62nd Dr
- 15902 W 64th Ave
- 6476 Orion Way
- 6271 Mcintyre Way
- 6462 Quartz Cir
- 16690 W 63rd Place
- 15492 W 65th Ave Unit C
- 15496 W 66th Dr Unit C
- 15516 W 66th Dr Unit A
- 15374 W 63rd Ave Unit 101
- 16887 W 62nd Place
- 15894 W 67th Place
- 6264 Salvia Ln
- 15233 W 65th Ave Unit C
- 16929 W 63rd Ln
- 15957 W 60th Cir
- 16965 W 62nd Cir
- 15296 W 66th Dr Unit G
- 16071 W 63rd Ln Unit C
- 16071 W 63rd Ln Unit B
- 16071 W 63rd Ln Unit E
- 16071 W 63rd Ln Unit D
- 16141 W 63rd Ln Unit 202
- 16141 W 63rd Ln Unit 201
- 16141 W 63rd Ln Unit 103
- 16141 W 63rd Ln Unit 102
- 16141 W 63rd Ln Unit 101
- 16141 W 63rd Ln
- 16141 W 63rd Ln Unit 202
- 16031 W 63rd Ln Unit C
- 16031 W 63rd Ln Unit A
- 16031 W 63rd Ln Unit E
- 16031 W 63rd Ln Unit 6B
- 16062 W 63rd Ln
- 16062 W 63rd Ln Unit A
- 16062 W 63rd Ln Unit C
- 16062 W 63rd Ln Unit E
- 16062 W 63rd Ln Unit B