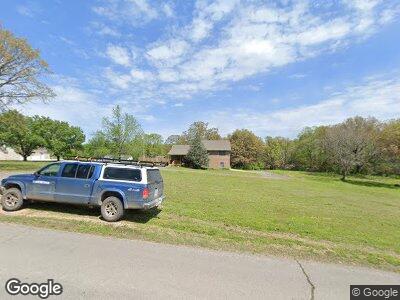
16078 W Jones Rd Tahlequah, OK 74464
Estimated Value: $195,191 - $239,000
2
Beds
2
Baths
1,360
Sq Ft
$163/Sq Ft
Est. Value
About This Home
This home is located at 16078 W Jones Rd, Tahlequah, OK 74464 and is currently estimated at $221,798, approximately $163 per square foot. 16078 W Jones Rd is a home located in Cherokee County with nearby schools including Grand View Public School.
Ownership History
Date
Name
Owned For
Owner Type
Purchase Details
Closed on
Jan 11, 2023
Sold by
Herrlein Jill Lynn
Bought by
Jill Herrlein Family Trust
Current Estimated Value
Purchase Details
Closed on
Dec 22, 2009
Sold by
Williams Amanda June and Williams Michael Byron
Bought by
Herrlein Jill Lynn
Home Financials for this Owner
Home Financials are based on the most recent Mortgage that was taken out on this home.
Original Mortgage
$100,000
Interest Rate
4.9%
Mortgage Type
New Conventional
Purchase Details
Closed on
Aug 14, 2007
Sold by
Bach Jacqueline and Bach Richard
Bought by
Williams Michael Byron and Williams Amanda June
Home Financials for this Owner
Home Financials are based on the most recent Mortgage that was taken out on this home.
Original Mortgage
$129,500
Interest Rate
6.69%
Mortgage Type
New Conventional
Purchase Details
Closed on
Jul 14, 1997
Sold by
Lillian Stephens B
Bought by
Richard Bach
Create a Home Valuation Report for This Property
The Home Valuation Report is an in-depth analysis detailing your home's value as well as a comparison with similar homes in the area
Home Values in the Area
Average Home Value in this Area
Purchase History
| Date | Buyer | Sale Price | Title Company |
|---|---|---|---|
| Jill Herrlein Family Trust | -- | -- | |
| Herrlein Jill Lynn | $125,000 | None Available | |
| Williams Michael Byron | $129,500 | Tahlequah Abstract Closing S | |
| Richard Bach | $6,100 | -- |
Source: Public Records
Mortgage History
| Date | Status | Borrower | Loan Amount |
|---|---|---|---|
| Previous Owner | Herrlein Jill Lynn | $100,000 | |
| Previous Owner | Williams Michael Byron | $129,500 |
Source: Public Records
Tax History Compared to Growth
Tax History
| Year | Tax Paid | Tax Assessment Tax Assessment Total Assessment is a certain percentage of the fair market value that is determined by local assessors to be the total taxable value of land and additions on the property. | Land | Improvement |
|---|---|---|---|---|
| 2024 | $1,314 | $15,824 | $1,346 | $14,478 |
| 2023 | $1,314 | $15,362 | $1,731 | $13,631 |
| 2022 | $1,090 | $15,362 | $1,731 | $13,631 |
| 2021 | $1,090 | $15,362 | $1,731 | $13,631 |
| 2020 | $1,090 | $15,362 | $1,731 | $13,631 |
| 2019 | $1,191 | $15,362 | $1,731 | $13,631 |
| 2018 | $1,199 | $15,362 | $1,731 | $13,631 |
| 2017 | $1,149 | $14,634 | $1,648 | $12,986 |
| 2016 | $1,102 | $13,937 | $1,262 | $12,675 |
| 2015 | $1,083 | $13,273 | $1,346 | $11,927 |
| 2014 | $1,083 | $13,750 | $1,386 | $12,364 |
Source: Public Records
Map
Nearby Homes
- 16680 W Jones Rd
- 0 W Jones Rd
- 15318 W Jones Rd
- 17564 W Grandview Dr
- 0012 E Clover Cir
- 0010 E Clover Cir
- 17540 W Tray
- 0 W Burchett Rd Unit 2518831
- 16759 W Burchett Rd
- 0 W Woodard Rd
- 18185 Hilltop Cir
- 13552 State Highway 82
- 0 N Hwy 82 Hwy Unit 2518924
- 13626 State Highway 82
- 20 W Grandview Rd
- 16509 N Bryant Rd
- 1802 N Vinita Ave
- 13370 N Pine Ridge Dr
- 1702 N Vinita Ave
- 1998 W Allen Rd
- 16078 W Jones Rd
- 16068 W Jones Rd
- 13906 N 491 Rd
- 13874 N 491 Rd
- 16207 W Jones Rd
- 16069 W Jones Rd
- 16198 W Jones Rd
- 16141 W Jones Rd
- 13842 N 491 Rd
- 15920 W Jones Rd
- 16277 W Jones Rd
- 16418 W Jones Rd
- 15696 W Jones Rd
- 13806 N 491 Rd
- 14161 N 486 Rd
- 15574 W Jones Rd
- 15670 W Jones Rd
- 16522 W Jones Rd
- 16634 W Jones Rd
- 16607 W Jones Rd