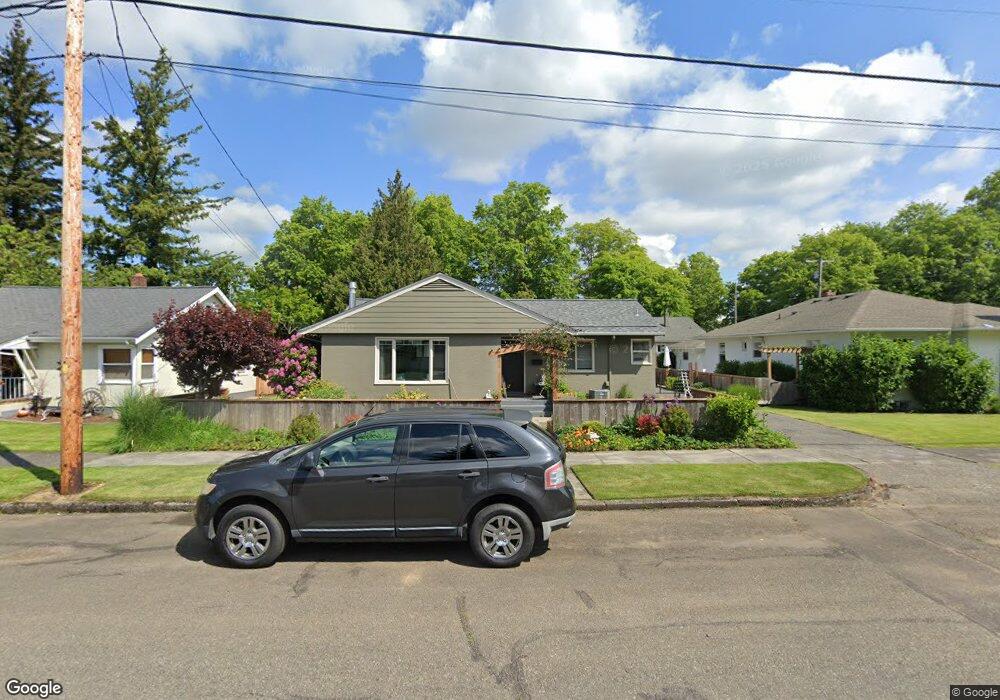
1608 E St Lynden, WA 98264
Estimated Value: $471,000 - $544,228
2
Beds
1
Bath
1,960
Sq Ft
$260/Sq Ft
Est. Value
About This Home
This home is located at 1608 E St, Lynden, WA 98264 and is currently estimated at $508,807, approximately $259 per square foot. 1608 E St is a home located in Whatcom County with nearby schools including Lynden High School, Lynden Christian School, and Lynden Christian Schools: Administration.
Ownership History
Date
Name
Owned For
Owner Type
Purchase Details
Closed on
Aug 26, 2025
Sold by
Humen Joan L
Bought by
Humen Joan L and Bogaard Lara J
Current Estimated Value
Purchase Details
Closed on
Oct 23, 2017
Sold by
Bogaard Aaron P and Bogaard Lara J
Bought by
Humen Joan L
Home Financials for this Owner
Home Financials are based on the most recent Mortgage that was taken out on this home.
Original Mortgage
$239,200
Interest Rate
3.78%
Mortgage Type
New Conventional
Purchase Details
Closed on
Jun 23, 2008
Sold by
Atneosen Curtis G and Atneosen Katharine D
Bought by
Bogaard Aaron P and Bogaard Lara J
Home Financials for this Owner
Home Financials are based on the most recent Mortgage that was taken out on this home.
Original Mortgage
$187,600
Interest Rate
5.99%
Mortgage Type
Purchase Money Mortgage
Purchase Details
Closed on
Mar 28, 2000
Sold by
Eiford Family Ltd Liability Company
Bought by
Kohl Construction Inc
Home Financials for this Owner
Home Financials are based on the most recent Mortgage that was taken out on this home.
Original Mortgage
$1,448,000
Interest Rate
8.38%
Mortgage Type
Construction
Create a Home Valuation Report for This Property
The Home Valuation Report is an in-depth analysis detailing your home's value as well as a comparison with similar homes in the area
Home Values in the Area
Average Home Value in this Area
Purchase History
| Date | Buyer | Sale Price | Title Company |
|---|---|---|---|
| Humen Joan L | $313 | Simplifile (Recording Service) | |
| Humen Joan L | $299,000 | Chicago Title Insurance | |
| Bogaard Aaron P | $234,780 | Chicago Title Insurance | |
| Kohl Construction Inc | $405,000 | Chicago Title Insurance Co |
Source: Public Records
Mortgage History
| Date | Status | Borrower | Loan Amount |
|---|---|---|---|
| Previous Owner | Humen Joan L | $239,200 | |
| Previous Owner | Bogaard Aaron P | $187,600 | |
| Previous Owner | Kohl Construction Inc | $1,448,000 |
Source: Public Records
Tax History
| Year | Tax Paid | Tax Assessment Tax Assessment Total Assessment is a certain percentage of the fair market value that is determined by local assessors to be the total taxable value of land and additions on the property. | Land | Improvement |
|---|---|---|---|---|
| 2025 | $3,432 | $472,543 | $245,543 | $227,000 |
| 2024 | $3,238 | $452,271 | $218,250 | $234,021 |
| 2023 | $3,238 | $450,020 | $225,000 | $225,020 |
| 2022 | $2,435 | $319,165 | $118,685 | $200,480 |
| 2021 | $2,388 | $263,770 | $98,086 | $165,684 |
| 2020 | $2,093 | $235,515 | $87,579 | $147,936 |
| 2019 | $1,862 | $216,020 | $80,412 | $135,608 |
| 2018 | $2,035 | $196,987 | $73,252 | $123,735 |
| 2017 | $1,834 | $176,813 | $65,750 | $111,063 |
| 2016 | $1,735 | $169,498 | $60,500 | $108,998 |
| 2015 | $1,538 | $159,413 | $58,190 | $101,223 |
| 2014 | -- | $154,010 | $56,210 | $97,800 |
| 2013 | -- | $152,800 | $55,000 | $97,800 |
Source: Public Records
Map
Nearby Homes
- 1717 E St
- 1656 Liberty St Unit 101
- 1218 Front St
- 108 Fairside Dr Unit 1
- 1594 Farmview Terrace
- 1774 Farmview Terrace
- 1701 Farmview Terrace
- 1710 Farmview Terrace
- 0 Guide Meridian Unit NWM2369980
- 919 Liberty St
- 915 Front St
- 1806 Fairview Ct
- 1884 Front St Unit B
- 1884 Front St
- 1884 Front St Unit A
- 410 10th St
- 1882 Front St Unit B302
- 802 Edson St
- 801 19th St
- 8424 Double Ditch Rd
Your Personal Tour Guide
Ask me questions while you tour the home.