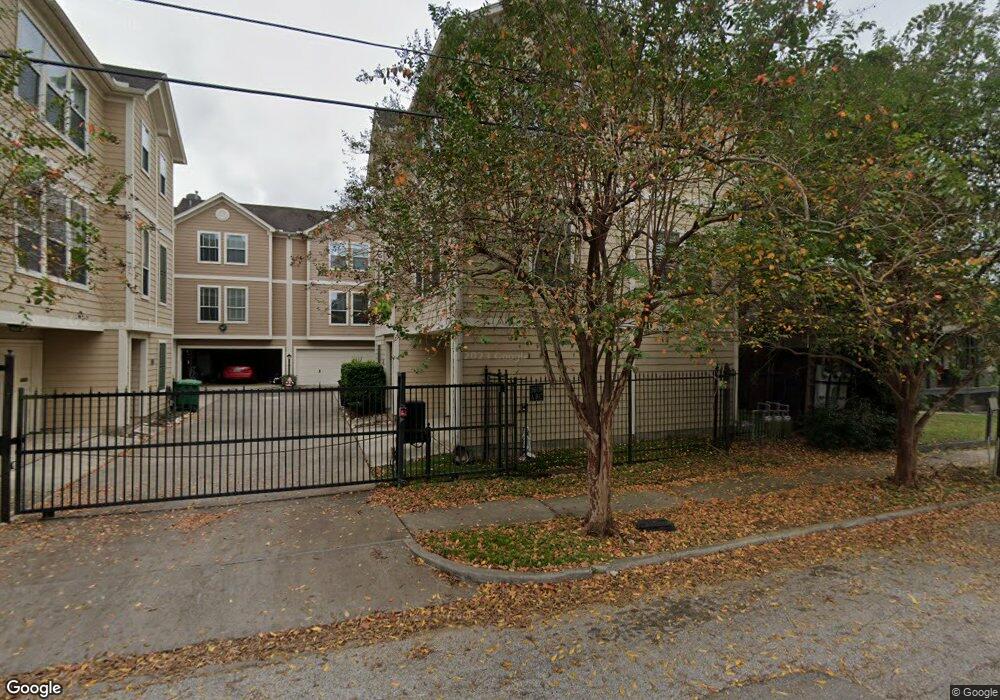
1608 Francis St Unit A Houston, TX 77004
Midtown NeighborhoodEstimated Value: $309,000 - $393,000
2
Beds
2
Baths
1,812
Sq Ft
$192/Sq Ft
Est. Value
About This Home
This home is located at 1608 Francis St Unit A, Houston, TX 77004 and is currently estimated at $347,691, approximately $191 per square foot. 1608 Francis St Unit A is a home located in Harris County with nearby schools including Gregory-Lincoln Ed Center, Lamar High School, and Elevate Collegiate.
Ownership History
Date
Name
Owned For
Owner Type
Purchase Details
Closed on
Sep 9, 2010
Sold by
Brookfield Global Relocation Services Ll
Bought by
Rossnagel Mark E
Current Estimated Value
Home Financials for this Owner
Home Financials are based on the most recent Mortgage that was taken out on this home.
Original Mortgage
$197,342
Outstanding Balance
$130,707
Interest Rate
4.5%
Mortgage Type
FHA
Estimated Equity
$216,984
Purchase Details
Closed on
May 10, 2010
Sold by
Wiegand Daniel P and Wiegand Peggy
Bought by
Brookfield Global Relocation Services Ll
Purchase Details
Closed on
Oct 11, 2005
Sold by
Perry Homes
Bought by
Wiegand Daniel P
Home Financials for this Owner
Home Financials are based on the most recent Mortgage that was taken out on this home.
Original Mortgage
$31,544
Interest Rate
5.73%
Mortgage Type
Unknown
Create a Home Valuation Report for This Property
The Home Valuation Report is an in-depth analysis detailing your home's value as well as a comparison with similar homes in the area
Home Values in the Area
Average Home Value in this Area
Purchase History
| Date | Buyer | Sale Price | Title Company |
|---|---|---|---|
| Rossnagel Mark E | -- | First American Title | |
| Brookfield Global Relocation Services Ll | -- | First American Title | |
| Wiegand Daniel P | -- | Chicago Title |
Source: Public Records
Mortgage History
| Date | Status | Borrower | Loan Amount |
|---|---|---|---|
| Open | Rossnagel Mark E | $197,342 | |
| Previous Owner | Wiegand Daniel P | $31,544 | |
| Previous Owner | Wiegand Daniel P | $168,236 |
Source: Public Records
Tax History Compared to Growth
Tax History
| Year | Tax Paid | Tax Assessment Tax Assessment Total Assessment is a certain percentage of the fair market value that is determined by local assessors to be the total taxable value of land and additions on the property. | Land | Improvement |
|---|---|---|---|---|
| 2025 | $1,253 | $328,241 | $77,300 | $250,941 |
| 2024 | $1,253 | $349,000 | $86,783 | $262,217 |
| 2023 | $1,253 | $346,574 | $86,783 | $259,791 |
| 2022 | $7,211 | $310,839 | $86,783 | $224,056 |
| 2021 | $6,866 | $294,594 | $86,783 | $207,811 |
| 2020 | $7,076 | $278,614 | $86,783 | $191,831 |
| 2019 | $7,151 | $270,000 | $86,783 | $183,217 |
| 2018 | $6,832 | $270,000 | $86,783 | $183,217 |
| 2017 | $7,146 | $270,000 | $86,783 | $183,217 |
| 2016 | $7,146 | $270,000 | $86,783 | $183,217 |
| 2015 | $7,212 | $270,000 | $86,783 | $183,217 |
| 2014 | $7,212 | $268,219 | $86,783 | $181,436 |
Source: Public Records
Map
Nearby Homes
- 1525 Francis St
- 3408 La Branch St Unit D
- 1505 Stuart St
- 3226 La Branch St
- 1602 Elgin St Unit 6
- 1602 Elgin St Unit 13
- 1602 Elgin St Unit 12
- 3504 Chenevert St Unit A
- 3610 Chenevert St
- 3501 Chenevert St Unit 7
- 3501 Chenevert St Unit 11
- 3501 Chenevert St Unit 19
- 1509 Elgin St
- 1706 Elgin St
- 1710 Elgin St
- 1718 Elgin St
- 3119 Austin St
- 1408 Alabama St
- 1507 Truxillo St Unit A
- 3105 Caroline St
- 1608 Francis St Unit C
- 1608 Francis St Unit B
- 1608 Francis St
- 1602 Francis St
- 1610 Francis St Unit C
- 1610 Francis St Unit B
- 1610 Francis St Unit A
- 1610 Francis St
- 1607 Holman St
- 1614 Francis St
- 1614 Francis St Unit A
- 1614 Francis St Unit B
- 1614 Francis St Unit C
- 1611 Holman St
- 1601 Holman St
- 1615 Holman St
- 1618 Francis St
- 1607 Francis St
- 3311 Crawford St Unit B
- 3311 Crawford St Unit A