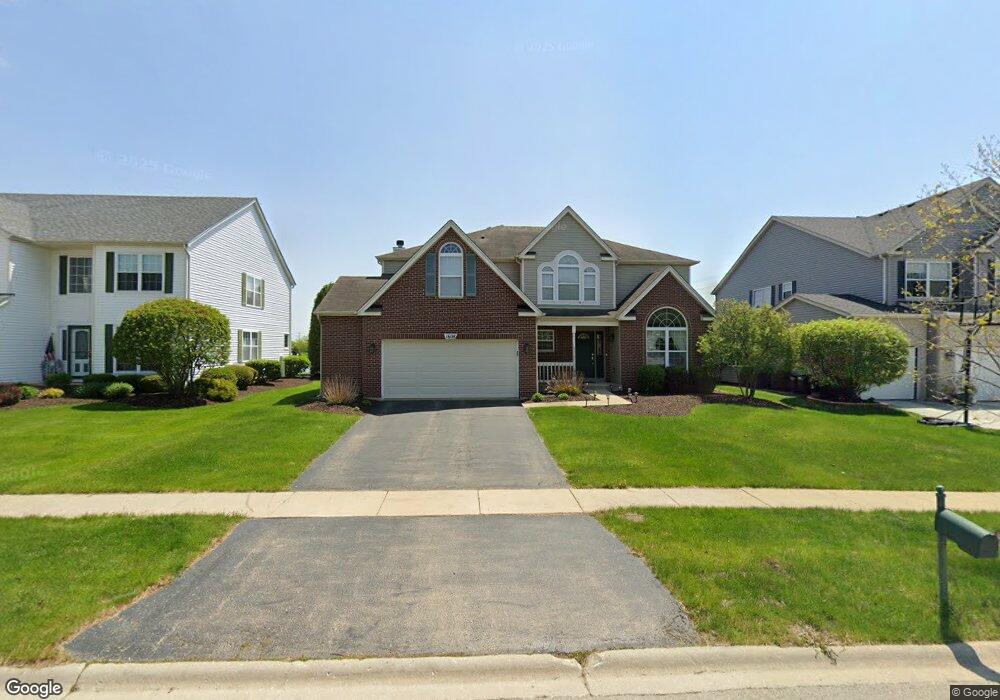
1608 Grand Highlands Dr Plainfield, IL 60586
Fall Creek NeighborhoodEstimated Value: $412,296 - $450,000
--
Bed
1
Bath
2,937
Sq Ft
$149/Sq Ft
Est. Value
About This Home
This home is located at 1608 Grand Highlands Dr, Plainfield, IL 60586 and is currently estimated at $436,824, approximately $148 per square foot. 1608 Grand Highlands Dr is a home located in Will County with nearby schools including Wesmere Elementary School, Drauden Point Middle School, and Plainfield South High School.
Ownership History
Date
Name
Owned For
Owner Type
Purchase Details
Closed on
May 29, 2001
Sold by
Hand Michael
Bought by
Kabaker Douglas J and Kabaker Heather E
Current Estimated Value
Home Financials for this Owner
Home Financials are based on the most recent Mortgage that was taken out on this home.
Original Mortgage
$244,600
Outstanding Balance
$92,969
Interest Rate
7.11%
Estimated Equity
$343,855
Purchase Details
Closed on
Feb 9, 2001
Sold by
Neumann Homes Inc
Bought by
Hand Michael
Home Financials for this Owner
Home Financials are based on the most recent Mortgage that was taken out on this home.
Original Mortgage
$195,000
Interest Rate
7.03%
Create a Home Valuation Report for This Property
The Home Valuation Report is an in-depth analysis detailing your home's value as well as a comparison with similar homes in the area
Home Values in the Area
Average Home Value in this Area
Purchase History
| Date | Buyer | Sale Price | Title Company |
|---|---|---|---|
| Kabaker Douglas J | $257,500 | Ticor Title | |
| Hand Michael | $244,500 | Chicago Title Insurance Co |
Source: Public Records
Mortgage History
| Date | Status | Borrower | Loan Amount |
|---|---|---|---|
| Open | Kabaker Douglas J | $244,600 | |
| Previous Owner | Hand Michael | $195,000 |
Source: Public Records
Tax History Compared to Growth
Tax History
| Year | Tax Paid | Tax Assessment Tax Assessment Total Assessment is a certain percentage of the fair market value that is determined by local assessors to be the total taxable value of land and additions on the property. | Land | Improvement |
|---|---|---|---|---|
| 2024 | $8,824 | $131,204 | $22,816 | $108,388 |
| 2023 | $8,824 | $118,501 | $20,607 | $97,894 |
| 2022 | $7,886 | $106,430 | $18,508 | $87,922 |
| 2021 | $7,481 | $99,467 | $17,297 | $82,170 |
| 2020 | $7,369 | $96,645 | $16,806 | $79,839 |
| 2019 | $7,114 | $92,086 | $16,013 | $76,073 |
| 2018 | $7,198 | $91,082 | $15,045 | $76,037 |
| 2017 | $6,987 | $86,555 | $14,297 | $72,258 |
| 2016 | $6,849 | $82,552 | $13,636 | $68,916 |
| 2015 | $6,492 | $77,332 | $12,774 | $64,558 |
| 2014 | $6,492 | $74,602 | $12,323 | $62,279 |
| 2013 | $6,492 | $74,602 | $12,323 | $62,279 |
Source: Public Records
Map
Nearby Homes
- 1504 Lasser Dr
- 1891 Westmore Grove Dr
- 1314 Martin Ct Unit 2
- 5302 Meadowbrook St
- 1905 Chestnut Grove Dr Unit 1
- 0 Theodore St
- 1910 Arbor Fields Dr
- 1605 Heritage Pointe Ct
- 5214 Riviera Blvd
- 2045 Winding Lakes Dr
- 1715 Pembrook Ct
- 1120 Trillium Ln
- 1707 Chestnut Hill Rd
- 1710 Chestnut Hill Rd
- 1213 Bridgehampton Dr
- 2108 Brookshire Estates Ct Unit 1
- 5117 Edgewater Ct Unit 1
- 5307 Brindlewood Dr
- 1903 Brighton Ln
- 1107 Shorewood Dr Unit 3
- 1610 Grand Highlands Dr
- 1606 Grand Highlands Dr Unit 1
- 1612 Grand Highlands Dr
- 1604 Grand Highlands Dr
- 1614 Grand Highlands Dr
- 1605 Grand Highlands Dr
- 1609 Grand Highlands Dr Unit 2B
- 1602 Grand Highlands Dr
- 1611 Grand Highlands Dr
- 1616 Grand Highlands Dr
- 1613 Grand Highlands Dr
- 5601 Grand Highlands Dr Unit 1
- 5600 Grand Highlands Dr
- 1618 Grand Highlands Dr Unit 2B
- 1615 Grand Highlands Dr
- 1606 Sierra Highlands Ct
- 1608 Sierra Highlands Ct
- 5602 Grand Highlands Dr Unit 1
- 5603 Grand Highlands Dr
- 1610 Sierra Highlands Ct