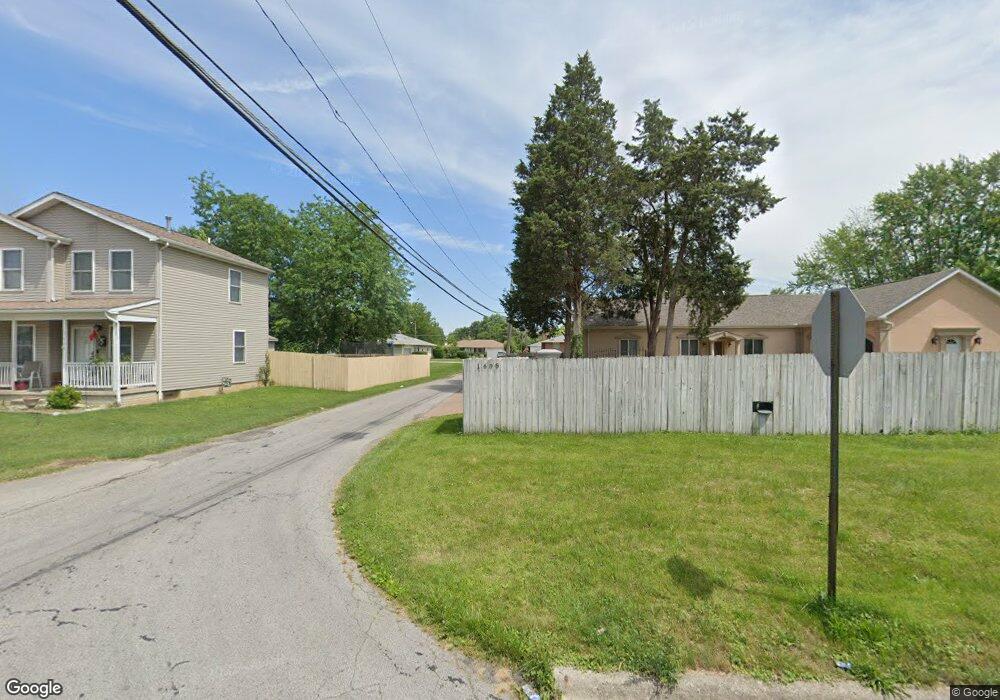
1608 Hanford St Columbus, OH 43206
Deshler Park NeighborhoodEstimated Value: $215,000 - $254,783
3
Beds
2
Baths
1,539
Sq Ft
$154/Sq Ft
Est. Value
About This Home
This home is located at 1608 Hanford St, Columbus, OH 43206 and is currently estimated at $237,446, approximately $154 per square foot. 1608 Hanford St is a home located in Franklin County with nearby schools including Moler Elementary School, South High School, and South Scioto Academy.
Ownership History
Date
Name
Owned For
Owner Type
Purchase Details
Closed on
May 18, 2006
Sold by
Hud
Bought by
Cabrera Edwin Yobani Ramirez
Current Estimated Value
Purchase Details
Closed on
Aug 9, 2005
Sold by
Zwiebel Carol S and Washington Mutual Bank Fa
Bought by
Hud
Purchase Details
Closed on
Mar 15, 2000
Sold by
Zwiebel Carol S and Todd Carol S
Bought by
Zwiebel Robert F and Zwiebel Carol S
Purchase Details
Closed on
Feb 8, 1996
Sold by
Swisher Garnet
Bought by
Carol S Todd
Home Financials for this Owner
Home Financials are based on the most recent Mortgage that was taken out on this home.
Original Mortgage
$46,421
Interest Rate
7.11%
Mortgage Type
FHA
Purchase Details
Closed on
Feb 27, 1991
Create a Home Valuation Report for This Property
The Home Valuation Report is an in-depth analysis detailing your home's value as well as a comparison with similar homes in the area
Home Values in the Area
Average Home Value in this Area
Purchase History
| Date | Buyer | Sale Price | Title Company |
|---|---|---|---|
| Cabrera Edwin Yobani Ramirez | $37,500 | Lakeside Ti | |
| Hud | $34,000 | Independent | |
| Zwiebel Robert F | -- | -- | |
| Carol S Todd | $46,200 | -- | |
| -- | -- | -- |
Source: Public Records
Mortgage History
| Date | Status | Borrower | Loan Amount |
|---|---|---|---|
| Previous Owner | Carol S Todd | $46,421 |
Source: Public Records
Tax History Compared to Growth
Tax History
| Year | Tax Paid | Tax Assessment Tax Assessment Total Assessment is a certain percentage of the fair market value that is determined by local assessors to be the total taxable value of land and additions on the property. | Land | Improvement |
|---|---|---|---|---|
| 2024 | $5,410 | $78,410 | $20,620 | $57,790 |
| 2023 | $3,474 | $78,400 | $20,615 | $57,785 |
| 2022 | $2,842 | $36,510 | $17,120 | $19,390 |
| 2021 | $1,897 | $36,510 | $17,120 | $19,390 |
| 2020 | $1,899 | $36,510 | $17,120 | $19,390 |
| 2019 | $1,905 | $31,400 | $14,880 | $16,520 |
| 2018 | $1,664 | $31,400 | $14,880 | $16,520 |
| 2017 | $1,855 | $30,600 | $14,880 | $15,720 |
| 2016 | $1,572 | $23,730 | $8,190 | $15,540 |
| 2015 | $1,427 | $23,730 | $8,190 | $15,540 |
| 2014 | $1,430 | $23,730 | $8,190 | $15,540 |
| 2013 | $742 | $24,955 | $8,610 | $16,345 |
Source: Public Records
Map
Nearby Homes
- 1443 Fairwood Ave
- 0 Moler Rd
- 1438 E Gates St
- 1619 Liscomb Rd
- 1673 Liscomb Rd
- 1642 Berkeley Rd
- 1424 E Deshler Ave
- 1871 Holburn Ave Unit 873
- 1671-1673 E Whittier St
- 1189 Fairwood Ave
- 1363 Kelton Ave
- 1634 E Whittier St
- 1614 E Whittier St Unit 1614/1616
- 1689 E Kossuth St
- 1418-1422 Miller Ave
- 1485 E Whittier St
- 1833 Berkeley Rd
- 1184-1186 Lilley Ave
- 1861 Berkeley Rd
- 1109 Fairwood Ave
- 1621 E Gates St
- 1596 Hanford St
- 1633 E Gates St
- 1615 E Gates St
- 1645 E Gates St
- 1588 Hanford St
- 1597 Hanford St
- 1599 E Gates St
- 1580 Hanford St
- 1589 Hanford St
- 1591 E Gates St
- 1581 Hanford St
- 1572 Hanford St
- 1624 Frebis Ave
- 1614 Frebis Ave
- 0 Frebis Ave
- 1644 Frebis Ave
- 1640 E Gates St
- 1585 E Gates St