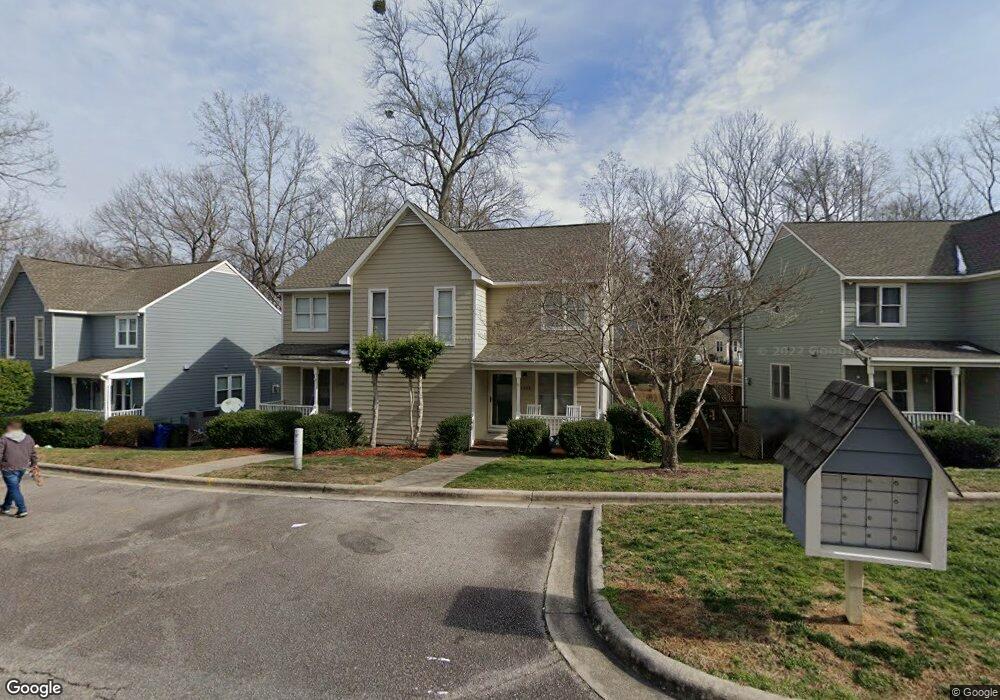
1608 Oakland Hills Way Raleigh, NC 27604
Hedingham NeighborhoodEstimated Value: $221,000 - $250,000
2
Beds
3
Baths
1,210
Sq Ft
$199/Sq Ft
Est. Value
About This Home
This home is located at 1608 Oakland Hills Way, Raleigh, NC 27604 and is currently estimated at $240,930, approximately $199 per square foot. 1608 Oakland Hills Way is a home located in Wake County with nearby schools including Beaverdam Elementary School, River Bend Middle, and Knightdale High.
Ownership History
Date
Name
Owned For
Owner Type
Purchase Details
Closed on
Sep 29, 2016
Sold by
Sluaghter Nathan and Sluaghter Laurie
Bought by
Woods Larry
Current Estimated Value
Home Financials for this Owner
Home Financials are based on the most recent Mortgage that was taken out on this home.
Original Mortgage
$117,727
Outstanding Balance
$94,290
Interest Rate
3.43%
Mortgage Type
FHA
Estimated Equity
$146,640
Purchase Details
Closed on
Mar 11, 2002
Sold by
Jones Leigh Anne
Bought by
Dean Carey
Home Financials for this Owner
Home Financials are based on the most recent Mortgage that was taken out on this home.
Original Mortgage
$92,250
Interest Rate
6.98%
Purchase Details
Closed on
Oct 29, 1998
Sold by
Carter Heath V
Bought by
Jones Leigh Anne
Home Financials for this Owner
Home Financials are based on the most recent Mortgage that was taken out on this home.
Original Mortgage
$81,200
Interest Rate
6.61%
Create a Home Valuation Report for This Property
The Home Valuation Report is an in-depth analysis detailing your home's value as well as a comparison with similar homes in the area
Home Values in the Area
Average Home Value in this Area
Purchase History
| Date | Buyer | Sale Price | Title Company |
|---|---|---|---|
| Woods Larry | $120,000 | None Available | |
| Dean Carey | $102,500 | -- | |
| Jones Leigh Anne | $101,500 | -- |
Source: Public Records
Mortgage History
| Date | Status | Borrower | Loan Amount |
|---|---|---|---|
| Open | Woods Larry | $117,727 | |
| Previous Owner | Dean Carey | $92,250 | |
| Previous Owner | Jones Leigh Anne | $81,200 | |
| Closed | Dean Carey | $4,000 |
Source: Public Records
Tax History Compared to Growth
Tax History
| Year | Tax Paid | Tax Assessment Tax Assessment Total Assessment is a certain percentage of the fair market value that is determined by local assessors to be the total taxable value of land and additions on the property. | Land | Improvement |
|---|---|---|---|---|
| 2025 | $2,131 | $242,106 | $45,000 | $197,106 |
| 2024 | $2,123 | $242,106 | $45,000 | $197,106 |
| 2023 | $1,662 | $150,650 | $30,000 | $120,650 |
| 2022 | $1,545 | $150,650 | $30,000 | $120,650 |
| 2021 | $1,486 | $150,650 | $30,000 | $120,650 |
| 2020 | $1,459 | $150,650 | $30,000 | $120,650 |
| 2019 | $1,271 | $107,912 | $28,000 | $79,912 |
| 2018 | $1,199 | $107,912 | $28,000 | $79,912 |
| 2017 | $1,143 | $107,912 | $28,000 | $79,912 |
| 2016 | $1,119 | $107,912 | $28,000 | $79,912 |
| 2015 | $1,149 | $109,063 | $28,000 | $81,063 |
| 2014 | $1,091 | $109,063 | $28,000 | $81,063 |
Source: Public Records
Map
Nearby Homes
- 1604 Oakland Hills Way
- 1600 Oakland Hills Way
- 1620 Oakland Hills Way
- 1626 Oakland Hills Way
- 1815 Crystal Downs Ln
- 1638 Oakland Hills Way
- 1701 Point Owoods Ct
- 1727 Crag Burn Ln
- 1928 Shadow Glen Dr
- 2330 Lazy River Dr
- 1936 Crag Burn Ln
- 1744 Kingston Heath Way
- 5456 Grand Traverse Dr
- 1526 Roaring Rapids Rd
- 2344 Lazy River Dr
- 5512 Grand Traverse Dr
- 2001 Turtle Point Dr
- 2013 Turtle Point Dr
- 1713 Kingston Heath Way
- 1961 Indianwood Ct
- 1606 Oakland Hills Way
- 1610 Oakland Hills Way
- 1612 Oakland Hills Way
- 1602 Oakland Hills Way
- 1712 Crystal Downs Ln
- 1605 Oakland Hills Way
- 1607 Oakland Hills Way
- 1529 Long Cove Ct
- 1609 Oakland Hills Way
- 1618 Oakland Hills Way
- 1603 Oakland Hills Way
- 1611 Oakland Hills Way
- 1601 Oakland Hills Way
- 1525 Long Cove Ct
- 1512 Oakland Hills Way
- 1613 Oakland Hills Way
- 1533 Long Cove Ct
- 1615 Oakland Hills Way
- 5301 Royal Troon Dr
- 1521 Long Cove Ct