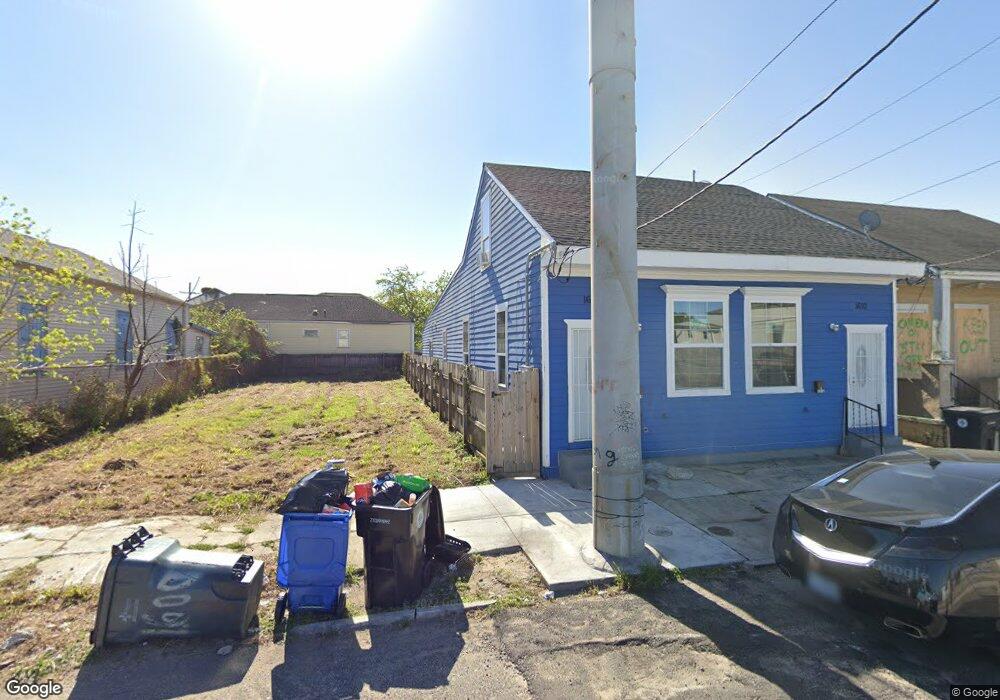
1608 Rev John Raphael Jr Way New Orleans, LA 70113
Central City NeighborhoodEstimated Value: $231,216 - $317,000
6
Beds
2
Baths
2,052
Sq Ft
$136/Sq Ft
Est. Value
About This Home
This home is located at 1608 Rev John Raphael Jr Way, New Orleans, LA 70113 and is currently estimated at $279,554, approximately $136 per square foot. 1608 Rev John Raphael Jr Way is a home located in Orleans Parish with nearby schools including Mary Bethune Elementary School, Kipp Central City Primary School, and Kipp Central City Academy.
Ownership History
Date
Name
Owned For
Owner Type
Purchase Details
Closed on
Feb 8, 2017
Sold by
Gusman Sheriff Marlin N
Bought by
Serpil Properties Llc
Current Estimated Value
Purchase Details
Closed on
Jul 23, 2007
Sold by
Mckines Joyce M
Bought by
Esmail Wafa Alasrama
Purchase Details
Closed on
Jun 15, 2007
Sold by
Bk Of New York Trust Co N
Bought by
Acid Joyce M M
Purchase Details
Closed on
Nov 26, 2003
Sold by
Upton Stover
Bought by
Ranzino Guy
Home Financials for this Owner
Home Financials are based on the most recent Mortgage that was taken out on this home.
Original Mortgage
$65,600
Interest Rate
6.06%
Create a Home Valuation Report for This Property
The Home Valuation Report is an in-depth analysis detailing your home's value as well as a comparison with similar homes in the area
Home Values in the Area
Average Home Value in this Area
Purchase History
| Date | Buyer | Sale Price | Title Company |
|---|---|---|---|
| Serpil Properties Llc | -- | None Available | |
| Esmail Wafa Alasrama | $35,000 | -- | |
| Acid Joyce M M | $6,000 | -- | |
| Ranzino Guy | $82,000 | -- |
Source: Public Records
Mortgage History
| Date | Status | Borrower | Loan Amount |
|---|---|---|---|
| Previous Owner | Ranzino Guy | $65,600 |
Source: Public Records
Tax History Compared to Growth
Tax History
| Year | Tax Paid | Tax Assessment Tax Assessment Total Assessment is a certain percentage of the fair market value that is determined by local assessors to be the total taxable value of land and additions on the property. | Land | Improvement |
|---|---|---|---|---|
| 2025 | $3,498 | $26,500 | $2,380 | $24,120 |
| 2024 | $3,551 | $26,500 | $2,380 | $24,120 |
| 2023 | $803 | $5,950 | $1,190 | $4,760 |
| 2022 | $803 | $5,710 | $1,190 | $4,520 |
| 2021 | $856 | $5,950 | $1,190 | $4,760 |
| 2020 | $865 | $5,950 | $1,190 | $4,760 |
| 2019 | $899 | $5,950 | $1,190 | $4,760 |
| 2018 | $917 | $5,950 | $1,190 | $4,760 |
| 2017 | $1,883 | $12,800 | $1,190 | $11,610 |
| 2016 | $1,943 | $12,800 | $1,190 | $11,610 |
| 2015 | $1,903 | $12,800 | $1,190 | $11,610 |
| 2014 | -- | $12,800 | $3,500 | $9,300 |
| 2013 | -- | $12,800 | $3,500 | $9,300 |
Source: Public Records
Map
Nearby Homes
- 2008 Reverend John Raphael Junior Way
- 2012 Reverend John Raphael Junior Way
- 1620 Reverend John Raphael Junior Way
- 1600 Rev John Raphael Jr Way
- 2316 Martin Luther King Junior Blvd
- 2504 Martin Luther King Junior Blvd
- 2429 Felicity St
- 2327-29 Josephine St
- 2809 Thalia St
- 2233 Josephine St
- 2223 Josephine St
- 2822 Thalia St
- 2714 Magnolia St
- 2121 Saint Andrew St
- 2117 Saint Andrew St
- 2013 15 St Andrew St
- 2425 Philip St
- 1608 Rev John Raphael Jr Way
- 2215 Reverend John Raphael Junior Way
- 1139 Reverend John Raphael Junior Way
- 1608 10 Lasalle St
- 1616 Reverend John Raphael Junior Way
- 1614 Lasalle St
- 1614 16 Lasalle St
- 1614 Reverend John Raphael Junior Way
- 1604 Lasalle St
- 1600 Lasalle St
- 1600 Reverend John Raphael Junior Way
- 2227 Rev John Raphael Jr Way
- 1601 Lasalle St
- 2226 Terpsichore St
- 2231 Felicity St Unit A&B
- 2231 Felicity St
- 2309 Felicity St
- 2222 Terpsichore St
- 1526 Rev John Raphael Jr Way
- 2227 Felicity St