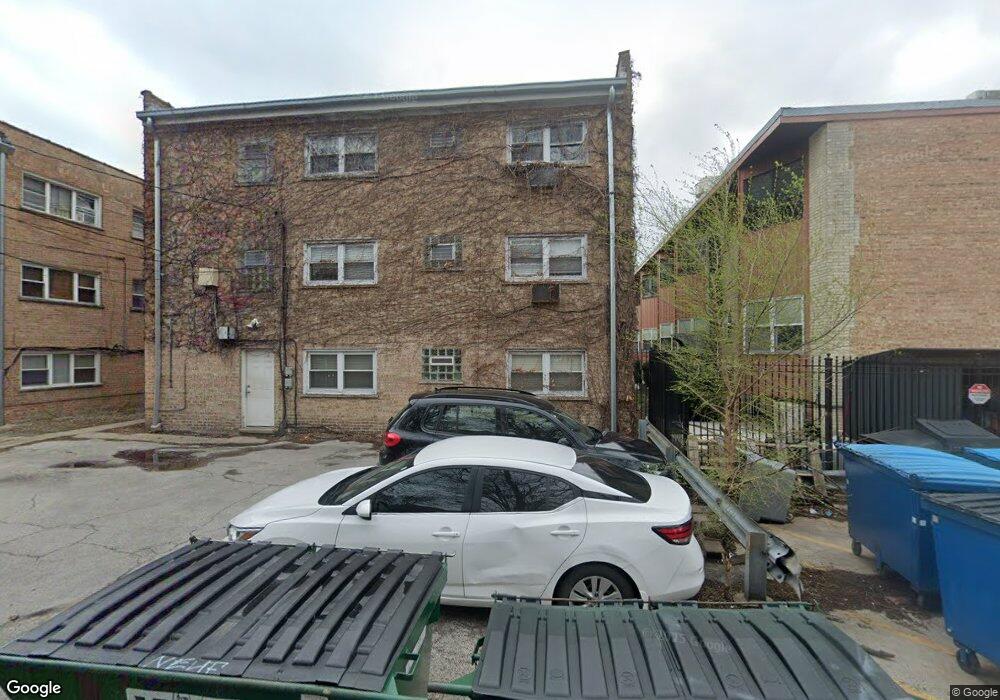
1608 W Chase Ave Unit 16081B Chicago, IL 60626
Rogers Park NeighborhoodEstimated Value: $183,000 - $189,245
2
Beds
1
Bath
980
Sq Ft
$190/Sq Ft
Est. Value
About This Home
This home is located at 1608 W Chase Ave Unit 16081B, Chicago, IL 60626 and is currently estimated at $186,311, approximately $190 per square foot. 1608 W Chase Ave Unit 16081B is a home located in Cook County with nearby schools including Gale Elementary Community Academy, Sullivan High School, and Chicago Math and Science Academy.
Ownership History
Date
Name
Owned For
Owner Type
Purchase Details
Closed on
Jul 23, 2025
Sold by
Stan Elena and Morar Elena
Bought by
Foxwell Dylan K and Welch Lucas
Current Estimated Value
Home Financials for this Owner
Home Financials are based on the most recent Mortgage that was taken out on this home.
Original Mortgage
$144,000
Outstanding Balance
$143,745
Interest Rate
6.63%
Mortgage Type
New Conventional
Estimated Equity
$42,566
Purchase Details
Closed on
Feb 20, 2002
Sold by
Stan Relu
Bought by
Morar Elena
Home Financials for this Owner
Home Financials are based on the most recent Mortgage that was taken out on this home.
Original Mortgage
$120,000
Interest Rate
7%
Purchase Details
Closed on
Mar 15, 2001
Sold by
Coastal Banc
Bought by
Stan Relu
Purchase Details
Closed on
Sep 25, 2000
Sold by
Condomini Klecyngier Adam
Bought by
Coastal Banc
Create a Home Valuation Report for This Property
The Home Valuation Report is an in-depth analysis detailing your home's value as well as a comparison with similar homes in the area
Home Values in the Area
Average Home Value in this Area
Purchase History
| Date | Buyer | Sale Price | Title Company |
|---|---|---|---|
| Foxwell Dylan K | $180,000 | None Listed On Document | |
| Morar Elena | $150,000 | Chicago Title Insurance Co | |
| Stan Relu | $49,000 | -- | |
| Coastal Banc | -- | -- |
Source: Public Records
Mortgage History
| Date | Status | Borrower | Loan Amount |
|---|---|---|---|
| Open | Foxwell Dylan K | $144,000 | |
| Previous Owner | Morar Elena | $120,000 |
Source: Public Records
Tax History Compared to Growth
Tax History
| Year | Tax Paid | Tax Assessment Tax Assessment Total Assessment is a certain percentage of the fair market value that is determined by local assessors to be the total taxable value of land and additions on the property. | Land | Improvement |
|---|---|---|---|---|
| 2024 | $2,532 | $14,853 | $1,635 | $13,218 |
| 2023 | $2,468 | $12,000 | $1,308 | $10,692 |
| 2022 | $2,468 | $12,000 | $1,308 | $10,692 |
| 2021 | $2,413 | $11,999 | $1,308 | $10,691 |
| 2020 | $1,948 | $8,743 | $1,053 | $7,690 |
| 2019 | $1,958 | $9,746 | $1,053 | $8,693 |
| 2018 | $1,925 | $9,746 | $1,053 | $8,693 |
| 2017 | $2,974 | $13,817 | $944 | $12,873 |
| 2016 | $2,767 | $13,817 | $944 | $12,873 |
| 2015 | $2,532 | $13,817 | $944 | $12,873 |
| 2014 | $1,965 | $10,590 | $872 | $9,718 |
| 2013 | $1,926 | $10,590 | $872 | $9,718 |
Source: Public Records
Map
Nearby Homes
- 1630 W Chase Ave Unit 1N
- 1600 W Chase Ave Unit 3B
- 7321 N Paulina St Unit 73212
- 1640 W Sherwin Ave Unit 4D
- 7311 N Ashland Blvd Unit 1B
- 7311 N Ashland Blvd Unit 2A
- 1545 W Chase Ave Unit 305
- 1615 W Touhy Ave Unit 2N
- 1626 W Estes Ave Unit 1F
- 1529.5 W Estes Ave Unit 3B
- 1533 W Fargo Ave Unit 1W
- 1709 W Estes Ave Unit 1S
- 1535 W Estes Ave
- 1535 W Estes Ave Unit 3
- 1535 W Estes Ave Unit 1
- 1529 W Estes Ave Unit 1A
- 1810 W Touhy Ave
- 1511 W Birchwood Ave Unit 1F
- 1629 W Greenleaf Ave Unit 407
- 1645 W Greenleaf Ave Unit 3E
- 1608 W Chase Ave Unit 16081E
- 1608 W Chase Ave Unit 16081D
- 1608 W Chase Ave Unit 16081A
- 1608 W Chase Ave Unit 16081F
- 1608 W Chase Ave Unit 16081C
- 1608 W Chase Ave Unit 1
- 1608 W Chase Ave Unit 3A
- 1608 W Chase Ave Unit 2
- 1606 W Chase Ave Unit 2B
- 1606 W Chase Ave Unit 16061A
- 1606 W Chase Ave Unit 16062B
- 1606 W Chase Ave Unit 16063C
- 1606 W Chase Ave Unit 1A
- 7306 N Ashland Blvd Unit 3D
- 7306 N Ashland Blvd Unit 3C
- 1600 W Chase Ave Unit 3L
- 1600 W Chase Ave Unit 1C
- 1600 W Chase Ave Unit 3C
- 1600 W Chase Ave Unit 2B
- 1600 W Chase Ave Unit 1A