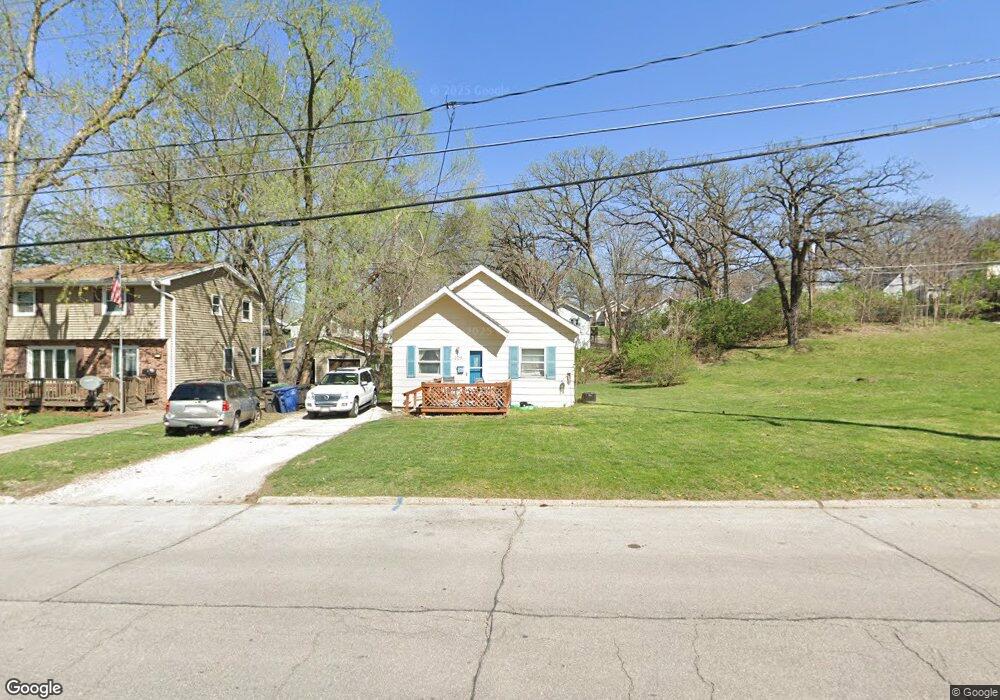
1609 34th St Des Moines, IA 50310
Drake NeighborhoodEstimated Value: $175,000 - $208,000
2
Beds
2
Baths
672
Sq Ft
$275/Sq Ft
Est. Value
About This Home
This home is located at 1609 34th St, Des Moines, IA 50310 and is currently estimated at $185,006, approximately $275 per square foot. 1609 34th St is a home located in Polk County with nearby schools including Perkins Elementary School, Meredith Middle School, and Hoover High School.
Ownership History
Date
Name
Owned For
Owner Type
Purchase Details
Closed on
Oct 23, 2003
Sold by
Belew Christopher G
Bought by
Johnson Danean G
Current Estimated Value
Home Financials for this Owner
Home Financials are based on the most recent Mortgage that was taken out on this home.
Original Mortgage
$86,250
Outstanding Balance
$40,305
Interest Rate
6.23%
Mortgage Type
Purchase Money Mortgage
Estimated Equity
$144,701
Purchase Details
Closed on
Nov 13, 2000
Sold by
Cawley Curtis
Bought by
Belew Christopher G
Home Financials for this Owner
Home Financials are based on the most recent Mortgage that was taken out on this home.
Original Mortgage
$78,900
Interest Rate
7.87%
Mortgage Type
FHA
Purchase Details
Closed on
Oct 28, 2000
Sold by
Iowa Food Sales Company
Bought by
Cawley Curtis
Home Financials for this Owner
Home Financials are based on the most recent Mortgage that was taken out on this home.
Original Mortgage
$78,900
Interest Rate
7.87%
Mortgage Type
FHA
Create a Home Valuation Report for This Property
The Home Valuation Report is an in-depth analysis detailing your home's value as well as a comparison with similar homes in the area
Home Values in the Area
Average Home Value in this Area
Purchase History
| Date | Buyer | Sale Price | Title Company |
|---|---|---|---|
| Johnson Danean G | $86,500 | -- | |
| Belew Christopher G | $78,500 | -- | |
| Cawley Curtis | $14,500 | -- |
Source: Public Records
Mortgage History
| Date | Status | Borrower | Loan Amount |
|---|---|---|---|
| Open | Johnson Danean G | $86,250 | |
| Previous Owner | Belew Christopher G | $78,900 |
Source: Public Records
Tax History Compared to Growth
Tax History
| Year | Tax Paid | Tax Assessment Tax Assessment Total Assessment is a certain percentage of the fair market value that is determined by local assessors to be the total taxable value of land and additions on the property. | Land | Improvement |
|---|---|---|---|---|
| 2025 | $3,080 | $182,400 | $40,000 | $142,400 |
| 2024 | $3,080 | $167,000 | $36,100 | $130,900 |
| 2023 | $2,978 | $167,000 | $36,100 | $130,900 |
| 2022 | $2,952 | $135,200 | $29,600 | $105,600 |
| 2021 | $2,798 | $135,200 | $29,600 | $105,600 |
| 2020 | $2,900 | $120,700 | $26,400 | $94,300 |
| 2019 | $2,746 | $120,700 | $26,400 | $94,300 |
| 2018 | $2,712 | $110,700 | $23,700 | $87,000 |
| 2017 | $2,580 | $110,700 | $23,700 | $87,000 |
| 2016 | $2,508 | $103,900 | $21,900 | $82,000 |
| 2015 | $2,508 | $103,900 | $21,900 | $82,000 |
| 2014 | $2,340 | $100,300 | $20,900 | $79,400 |
Source: Public Records
Map
Nearby Homes