Estimated Value: $174,251 - $219,000
3
Beds
2
Baths
896
Sq Ft
$218/Sq Ft
Est. Value
About This Home
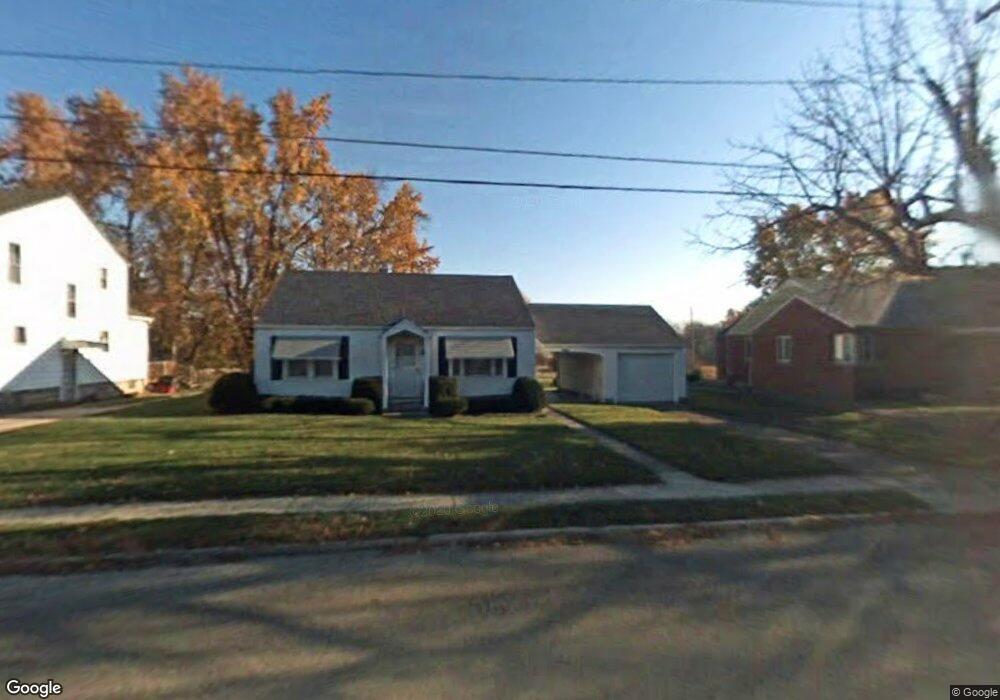
This home is located at 1609 Broadway, Piqua, OH 45356 and is currently estimated at $195,063, approximately $217 per square foot. 1609 Broadway is a home located in Miami County with nearby schools including Piqua Central Intermediate School, Springcreek Primary School, and Piqua Junior High School.
Ownership History
Date
Name
Owned For
Owner Type
Purchase Details
Closed on
Oct 21, 2011
Sold by
West Michelle Investments Llc
Bought by
Williams Alan H
Current Estimated Value
Home Financials for this Owner
Home Financials are based on the most recent Mortgage that was taken out on this home.
Original Mortgage
$77,484
Outstanding Balance
$52,898
Interest Rate
4.12%
Mortgage Type
FHA
Estimated Equity
$142,165
Purchase Details
Closed on
Jun 1, 2011
Sold by
Mcclusky Daisy
Bought by
West Michelle Investments Llc
Purchase Details
Closed on
Mar 22, 1994
Bought by
Mcclusky Daisy
Create a Home Valuation Report for This Property
The Home Valuation Report is an in-depth analysis detailing your home's value as well as a comparison with similar homes in the area
Home Values in the Area
Average Home Value in this Area
Purchase History
| Date | Buyer | Sale Price | Title Company |
|---|---|---|---|
| Williams Alan H | $79,500 | -- | |
| West Michelle Investments Llc | $32,000 | -- | |
| Mcclusky Daisy | -- | -- |
Source: Public Records
Mortgage History
| Date | Status | Borrower | Loan Amount |
|---|---|---|---|
| Open | West Michelle Investments Llc | $77,484 |
Source: Public Records
Tax History Compared to Growth
Tax History
| Year | Tax Paid | Tax Assessment Tax Assessment Total Assessment is a certain percentage of the fair market value that is determined by local assessors to be the total taxable value of land and additions on the property. | Land | Improvement |
|---|---|---|---|---|
| 2024 | $1,731 | $41,200 | $13,090 | $28,110 |
| 2023 | $1,731 | $41,200 | $13,090 | $28,110 |
| 2022 | $1,742 | $41,200 | $13,090 | $28,110 |
| 2021 | $1,469 | $31,710 | $10,080 | $21,630 |
| 2020 | $1,664 | $31,710 | $10,080 | $21,630 |
| 2019 | $1,690 | $31,710 | $10,080 | $21,630 |
| 2018 | $1,616 | $28,320 | $10,500 | $17,820 |
| 2017 | $1,651 | $28,320 | $10,500 | $17,820 |
| 2016 | $1,655 | $28,320 | $10,500 | $17,820 |
| 2015 | $1,669 | $27,200 | $10,080 | $17,120 |
| 2014 | $1,669 | $27,200 | $10,080 | $17,120 |
| 2013 | $1,692 | $27,200 | $10,080 | $17,120 |
Source: Public Records
Map
Nearby Homes