Estimated Value: $217,761 - $263,000
3
Beds
1
Bath
1,435
Sq Ft
$172/Sq Ft
Est. Value
About This Home
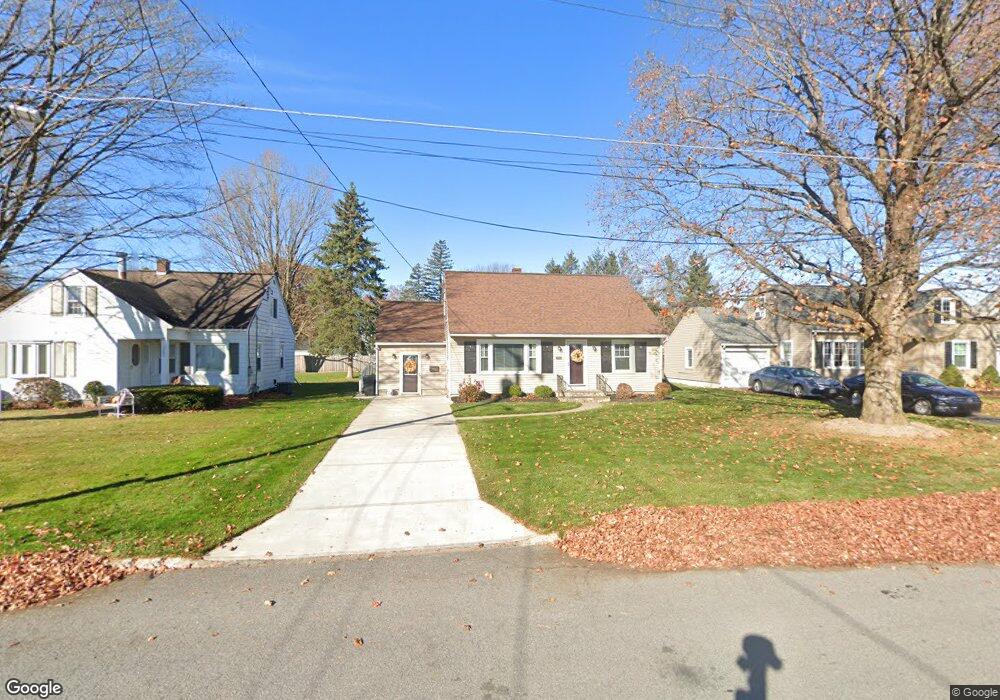
This home is located at 1609 Craig St, Rome, NY 13440 and is currently estimated at $246,440, approximately $171 per square foot. 1609 Craig St is a home located in Oneida County with nearby schools including Ridge Mills Elementary School, George R. Staley Upper Elementary School, and Lyndon H. Strough Middle School.
Ownership History
Date
Name
Owned For
Owner Type
Purchase Details
Closed on
Oct 3, 2016
Sold by
Major Martin
Bought by
Major Family Irrevocable
Current Estimated Value
Purchase Details
Closed on
Jul 15, 2011
Sold by
Weiman Shawn C
Bought by
Major Martin F
Purchase Details
Closed on
Jan 11, 2007
Sold by
Mumford Erin
Bought by
Corigliano Erin
Home Financials for this Owner
Home Financials are based on the most recent Mortgage that was taken out on this home.
Original Mortgage
$145,600
Interest Rate
6.18%
Mortgage Type
Purchase Money Mortgage
Purchase Details
Closed on
Dec 19, 2003
Sold by
Houseman Houseman J and Houseman S J
Bought by
Mumford Erin
Purchase Details
Closed on
May 6, 1999
Sold by
Barber Estate Ruth P
Bought by
Houseman James E and Houseman Sandra J
Create a Home Valuation Report for This Property
The Home Valuation Report is an in-depth analysis detailing your home's value as well as a comparison with similar homes in the area
Home Values in the Area
Average Home Value in this Area
Purchase History
| Date | Buyer | Sale Price | Title Company |
|---|---|---|---|
| Major Family Irrevocable | -- | Andrew K Ward | |
| Major Martin F | $142,000 | -- | |
| Corigliano Erin | $118,450 | David C Grow | |
| Mumford Erin | $82,000 | Camille Kahler | |
| Houseman James E | $52,500 | -- | |
| Houseman James E | $52,500 | -- | |
| Houseman James E | -- | Mcdermott Dennis K |
Source: Public Records
Mortgage History
| Date | Status | Borrower | Loan Amount |
|---|---|---|---|
| Previous Owner | Corigliano Erin | $145,600 |
Source: Public Records
Tax History Compared to Growth
Tax History
| Year | Tax Paid | Tax Assessment Tax Assessment Total Assessment is a certain percentage of the fair market value that is determined by local assessors to be the total taxable value of land and additions on the property. | Land | Improvement |
|---|---|---|---|---|
| 2024 | $3,238 | $68,300 | $17,400 | $50,900 |
| 2023 | $1,932 | $68,300 | $17,400 | $50,900 |
| 2022 | $3,090 | $68,300 | $17,400 | $50,900 |
| 2021 | $2,995 | $68,300 | $17,400 | $50,900 |
| 2020 | $2,964 | $68,300 | $17,400 | $50,900 |
| 2019 | $682 | $68,300 | $17,400 | $50,900 |
| 2018 | $2,798 | $68,300 | $17,400 | $50,900 |
| 2017 | $2,734 | $68,300 | $17,400 | $50,900 |
| 2016 | $4,438 | $68,300 | $17,400 | $50,900 |
| 2015 | -- | $68,300 | $17,400 | $50,900 |
| 2014 | -- | $68,300 | $17,400 | $50,900 |
Source: Public Records
Map
Nearby Homes
- 900 Turin St
- 105 Birchwood Cir
- 404 Walnut St
- 1614 N Madison St
- 409 Walnut St
- 1503 N George St
- 611 Turin St
- 1413 N George St
- 1610 N George St
- 1914 N Madison St
- 411 Ridgewood Dr
- 1711 N James St
- 7823 Turin Rd
- 1801 N George St
- 1809 Dunham Rd
- 1008 N Madison St
- 1205 N James St
- 301 W Locust St
- 429 Turin St
- 752 N Jay St
- 1607 Craig St
- 1611 Craig St
- 1605 Craig St
- 1615 Craig St
- 1606 Roser Terrace
- 1608 Roser Terrace
- 1604 Roser Terrace
- 1603 Craig St
- 1608 Craig St
- 1610 Craig St
- 1606 Craig St
- 1604 Craig St
- 1602 Roser Terrace
- 1612 Craig St
- 1601 Craig St
- 1600 Roser Terrace
- 504 W Cedar St
- 1609 Carroll St
- 1607 Roser Terrace
- 1611 Roser Terrace