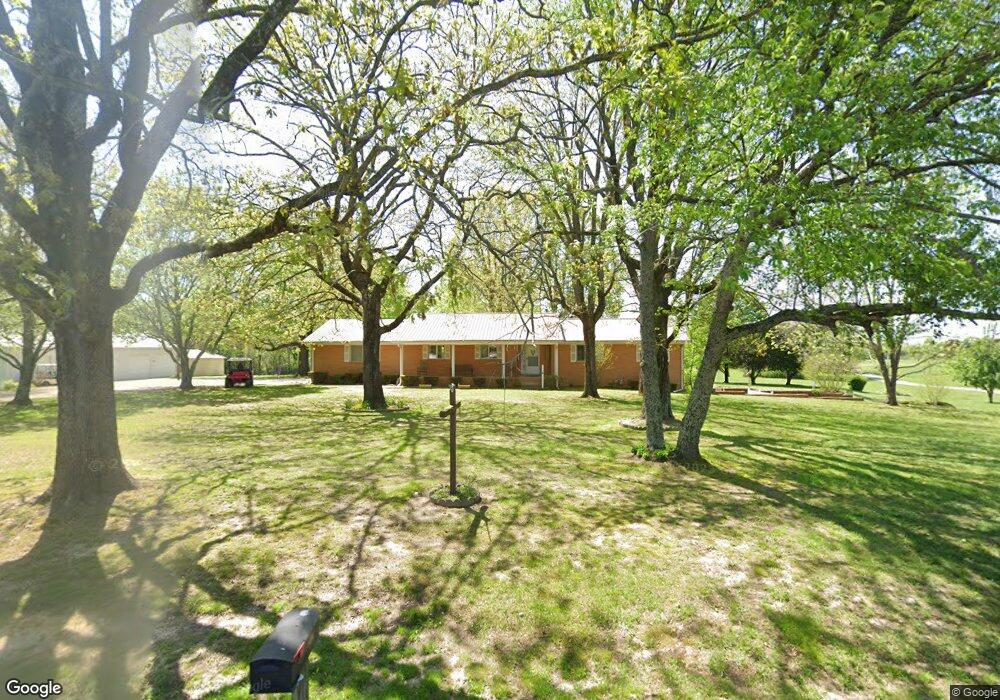
1609 Fall River Rd Lawrenceburg, TN 38464
Estimated Value: $269,002 - $530,000
--
Bed
2
Baths
1,392
Sq Ft
$253/Sq Ft
Est. Value
About This Home
This home is located at 1609 Fall River Rd, Lawrenceburg, TN 38464 and is currently estimated at $351,501, approximately $252 per square foot. 1609 Fall River Rd is a home located in Lawrence County with nearby schools including Lawrenceburg Public Elementary School, Ingram Sowell Elementary School, and David Crockett Elementary School.
Ownership History
Date
Name
Owned For
Owner Type
Purchase Details
Closed on
Sep 14, 2012
Bought by
Seymore Hobert D and Seymore Faye
Current Estimated Value
Purchase Details
Closed on
Feb 24, 1997
Sold by
Beck Richard C
Bought by
Beck Richard C
Purchase Details
Closed on
Nov 7, 1996
Sold by
Ghp Inc
Bought by
Seymore James H and Seymore Cora S
Purchase Details
Closed on
Jun 17, 1996
Sold by
Beasley Cyrus C
Bought by
Ghp Inc
Create a Home Valuation Report for This Property
The Home Valuation Report is an in-depth analysis detailing your home's value as well as a comparison with similar homes in the area
Home Values in the Area
Average Home Value in this Area
Purchase History
| Date | Buyer | Sale Price | Title Company |
|---|---|---|---|
| Seymore Hobert D | -- | -- | |
| Beck Richard C | $25,000 | -- | |
| Seymore James H | $115,000 | -- | |
| Ghp Inc | $362,000 | -- |
Source: Public Records
Tax History Compared to Growth
Tax History
| Year | Tax Paid | Tax Assessment Tax Assessment Total Assessment is a certain percentage of the fair market value that is determined by local assessors to be the total taxable value of land and additions on the property. | Land | Improvement |
|---|---|---|---|---|
| 2025 | $1,157 | $57,525 | $0 | $0 |
| 2024 | $1,157 | $57,525 | $11,125 | $46,400 |
| 2023 | $1,157 | $57,525 | $11,125 | $46,400 |
| 2022 | $1,157 | $57,525 | $11,125 | $46,400 |
| 2021 | $1,073 | $36,275 | $6,700 | $29,575 |
| 2020 | $1,073 | $36,275 | $6,700 | $29,575 |
| 2019 | $1,073 | $36,275 | $6,700 | $29,575 |
| 2018 | $1,073 | $36,275 | $6,700 | $29,575 |
| 2017 | $1,073 | $36,275 | $6,700 | $29,575 |
| 2016 | $1,073 | $36,275 | $6,700 | $29,575 |
| 2015 | $993 | $36,275 | $6,700 | $29,575 |
| 2014 | $981 | $35,825 | $6,700 | $29,125 |
Source: Public Records
Map
Nearby Homes
- 34 Baker Ct
- 45 Baker Ct
- 1111 Baker Ln
- 1448 Baker Ln
- 1408 Baker Ln
- 1261 Brannon Rd
- 1209 Wesley Ct
- 1325 Matthew Ave
- 33 Bishop Rd
- 0 Cecile Ct
- 107 Pond Dr
- 123 Quail Dr
- 1122 Brannon Rd
- 1876 Fall River Rd
- 19 Horseshoe Bend Rd
- 2290 Grandview Dr
- 786 Hillview Dr
- 79 Bishop Rd
- 910 Willow Dr
- 107 Horseshoe Bend Rd
- 1620 Fall River Rd
- 1610 Fall River Rd
- 1590 Fall River Rd
- 1647 Fall River Rd
- 1650 Fall River Rd
- 1585 Fall River Rd
- 19 Cardinal Ct
- 1565 Fall River Rd
- 1670 Fall River Rd
- 23 Cardinal Ct
- 1710 Fall River Rd
- 20 Cardinal Ct
- 1745 Fall River Rd
- 1525 Fall River Rd
- 1615 Baker Ln
- 24 Cardinal Ct
- 1501 Fall River Rd
- 1510 Fall River Rd
- 27 Cardinal Ct
- 1504 Fall River Rd