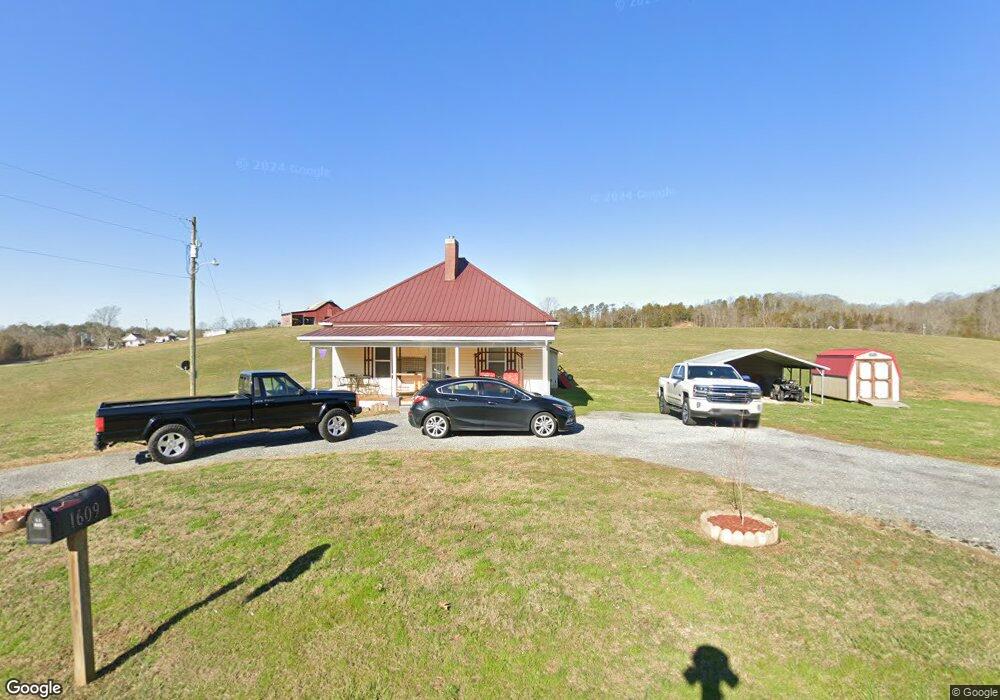
1609 Highway 66 Bulls Gap, TN 37711
Estimated Value: $88,625 - $140,000
--
Bed
1
Bath
780
Sq Ft
$156/Sq Ft
Est. Value
About This Home
This home is located at 1609 Highway 66, Bulls Gap, TN 37711 and is currently estimated at $121,906, approximately $156 per square foot. 1609 Highway 66 is a home located in Hawkins County with nearby schools including Bulls Gap School and Cherokee High School.
Ownership History
Date
Name
Owned For
Owner Type
Purchase Details
Closed on
May 19, 2021
Sold by
Hughes Ross C and Hughes Joyce E
Bought by
Rogers James Lewis
Current Estimated Value
Home Financials for this Owner
Home Financials are based on the most recent Mortgage that was taken out on this home.
Original Mortgage
$47,000
Outstanding Balance
$39,130
Interest Rate
3.1%
Mortgage Type
Seller Take Back
Estimated Equity
$82,776
Purchase Details
Closed on
Oct 30, 2013
Sold by
First Community Bank Of Ea
Bought by
Hughes Ross C and Hughes Joyce E
Home Financials for this Owner
Home Financials are based on the most recent Mortgage that was taken out on this home.
Original Mortgage
$27,200
Interest Rate
4.23%
Mortgage Type
Commercial
Purchase Details
Closed on
Aug 30, 2013
Sold by
Laster D Glenn
Bought by
First Community Bank Of East T
Purchase Details
Closed on
Jul 14, 1997
Bought by
Laster Glenn
Create a Home Valuation Report for This Property
The Home Valuation Report is an in-depth analysis detailing your home's value as well as a comparison with similar homes in the area
Home Values in the Area
Average Home Value in this Area
Purchase History
| Date | Buyer | Sale Price | Title Company |
|---|---|---|---|
| Rogers James Lewis | $52,000 | None Available | |
| Hughes Ross C | $32,000 | -- | |
| First Community Bank Of East T | $34,700 | -- | |
| Laster Glenn | $25,000 | -- |
Source: Public Records
Mortgage History
| Date | Status | Borrower | Loan Amount |
|---|---|---|---|
| Open | Rogers James Lewis | $47,000 | |
| Previous Owner | Hughes Ross C | $27,200 |
Source: Public Records
Tax History Compared to Growth
Tax History
| Year | Tax Paid | Tax Assessment Tax Assessment Total Assessment is a certain percentage of the fair market value that is determined by local assessors to be the total taxable value of land and additions on the property. | Land | Improvement |
|---|---|---|---|---|
| 2024 | $500 | $19,575 | $3,400 | $16,175 |
| 2023 | $455 | $19,575 | $0 | $0 |
| 2022 | $454 | $19,575 | $3,400 | $16,175 |
| 2021 | $404 | $19,575 | $3,400 | $16,175 |
| 2020 | $341 | $18,650 | $3,400 | $15,250 |
| 2019 | $341 | $13,475 | $3,400 | $10,075 |
| 2018 | $341 | $13,475 | $3,400 | $10,075 |
| 2017 | $341 | $13,475 | $3,400 | $10,075 |
| 2016 | $341 | $13,475 | $3,400 | $10,075 |
| 2015 | $332 | $13,475 | $3,400 | $10,075 |
| 2014 | $420 | $17,025 | $3,400 | $13,625 |
Source: Public Records
Map
Nearby Homes
- 113 Old Highway Rd
- 334 S Fork Branch Rd
- 0 Walkers Church
- Lot 1 Walkers Church Rd
- Lot 2 Walkers Church Rd
- TBD Gap Creek Rd
- Lot 2 Longtown Rd
- 185 Green Rd
- 231 Guthries Gap Rd
- 887 Berry Rd
- 0 Guthries Gap Rd Unit 611585
- 168 Buzzard Roost Rd
- 251 Speedwell Ln
- 284 Buzzard Roost Rd
- 204 Meadowview Rd
- 261 Buzzard Roost Rd
- 945 N Main St
- Lot 6 Cantrell Rd
- Lot 3 Cantrell Rd
- Lot 2 Cantrell Rd
- 126 Summitt Hill Rd
- 124 Wolfe Branch Rd
- 1625 Highway 66
- 223 Summitt Hill Rd
- 1701 Highway 66
- 119 Ridge Rd
- 110 Ridge Rd
- 1707 Highway 66 S
- 1707 Highway 66
- 1525 Highway 66
- 150 Summitt Hill Rd
- 139 Ridge Rd
- 148 Wolfe Branch Rd
- 1724 Highway 66
- 138 Ridge Rd
- 1727 Highway 66
- 157 Wolfe Branch Rd
- 207 Summitt Hill Rd
- 207 Summit Hill Rd
- 135 Freeman Rd