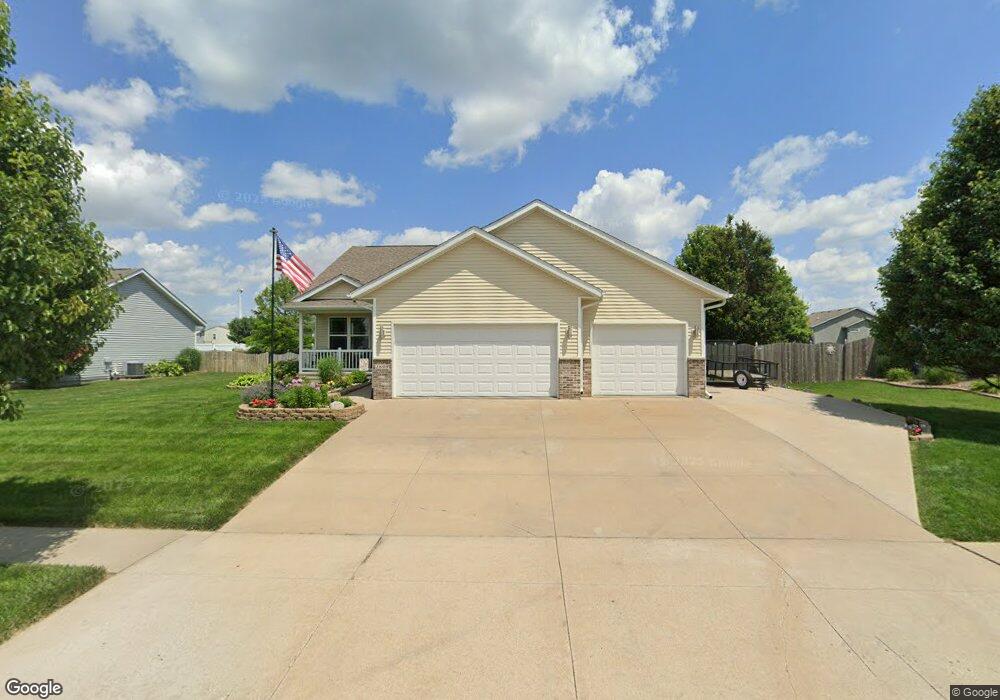
1609 Jenna Dr Davenport, IA 52804
Outer Davenport/Bettendorf NeighborhoodEstimated Value: $307,000 - $350,000
3
Beds
2
Baths
1,360
Sq Ft
$244/Sq Ft
Est. Value
About This Home
This home is located at 1609 Jenna Dr, Davenport, IA 52804 and is currently estimated at $331,895, approximately $244 per square foot. 1609 Jenna Dr is a home located in Scott County with nearby schools including Walnut Hill Elementary School, Jackson Elementary School, and Frank L. Smart Intermediate School.
Ownership History
Date
Name
Owned For
Owner Type
Purchase Details
Closed on
May 19, 2011
Sold by
Cunico Peter and Cunico Beth
Bought by
Each Justan D and Each Rebecca J
Current Estimated Value
Home Financials for this Owner
Home Financials are based on the most recent Mortgage that was taken out on this home.
Original Mortgage
$175,050
Outstanding Balance
$121,820
Interest Rate
4.91%
Mortgage Type
New Conventional
Estimated Equity
$210,075
Purchase Details
Closed on
Jun 30, 2009
Sold by
Two Horsemen Llc
Bought by
Cunico Peter and Cunico Beth
Home Financials for this Owner
Home Financials are based on the most recent Mortgage that was taken out on this home.
Original Mortgage
$191,369
Interest Rate
5.36%
Mortgage Type
FHA
Purchase Details
Closed on
Sep 12, 2008
Sold by
Jdhp Development Llc
Bought by
Iowa Llc
Create a Home Valuation Report for This Property
The Home Valuation Report is an in-depth analysis detailing your home's value as well as a comparison with similar homes in the area
Home Values in the Area
Average Home Value in this Area
Purchase History
| Date | Buyer | Sale Price | Title Company |
|---|---|---|---|
| Each Justan D | $194,500 | None Available | |
| Cunico Peter | $195,000 | None Available | |
| Iowa Llc | $272,000 | None Available |
Source: Public Records
Mortgage History
| Date | Status | Borrower | Loan Amount |
|---|---|---|---|
| Open | Each Justan D | $175,050 | |
| Previous Owner | Cunico Peter | $191,369 |
Source: Public Records
Tax History Compared to Growth
Tax History
| Year | Tax Paid | Tax Assessment Tax Assessment Total Assessment is a certain percentage of the fair market value that is determined by local assessors to be the total taxable value of land and additions on the property. | Land | Improvement |
|---|---|---|---|---|
| 2025 | $4,630 | $282,790 | $39,200 | $243,590 |
| 2024 | $4,514 | $269,260 | $39,200 | $230,060 |
| 2023 | $4,702 | $269,260 | $39,200 | $230,060 |
| 2022 | $4,722 | $229,010 | $35,280 | $193,730 |
| 2021 | $4,722 | $229,010 | $35,280 | $193,730 |
| 2020 | $4,478 | $214,920 | $35,280 | $179,640 |
| 2019 | $4,354 | $202,590 | $35,280 | $167,310 |
| 2018 | $4,064 | $202,590 | $35,280 | $167,310 |
| 2017 | $4,212 | $193,790 | $35,280 | $158,510 |
| 2016 | $4,064 | $194,320 | $0 | $0 |
| 2015 | $4,064 | $183,960 | $0 | $0 |
| 2014 | $3,892 | $183,960 | $0 | $0 |
| 2013 | $3,820 | $0 | $0 | $0 |
| 2012 | -- | $181,230 | $38,650 | $142,580 |
Source: Public Records
Map
Nearby Homes