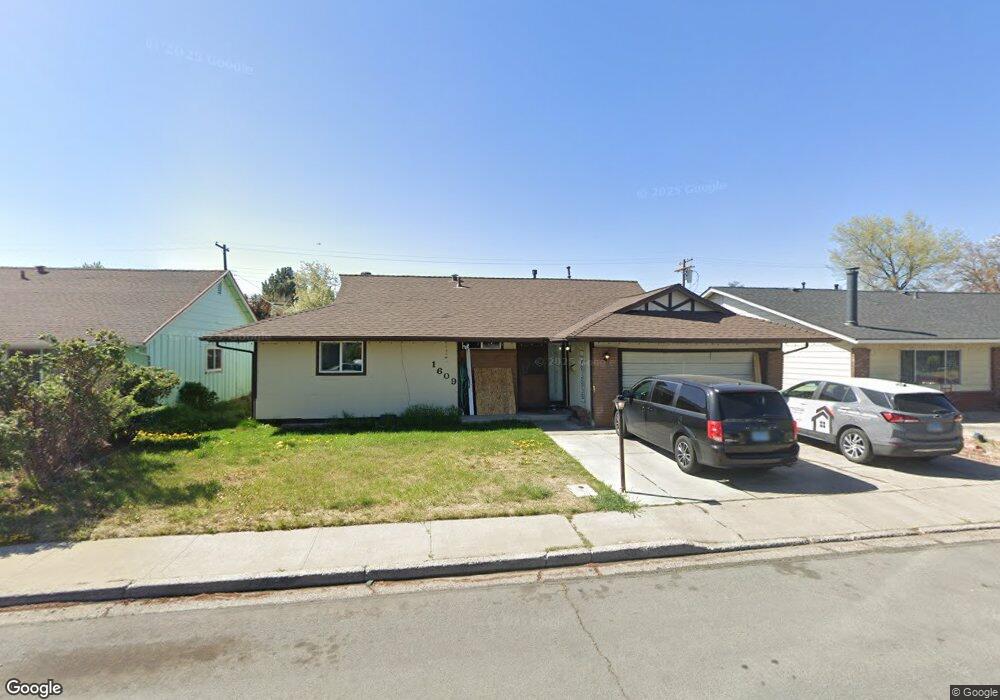
1609 Meadowvale Way Sparks, NV 89431
North Rock NeighborhoodEstimated Value: $418,000 - $453,000
3
Beds
2
Baths
1,997
Sq Ft
$220/Sq Ft
Est. Value
About This Home
This home is located at 1609 Meadowvale Way, Sparks, NV 89431 and is currently estimated at $438,731, approximately $219 per square foot. 1609 Meadowvale Way is a home located in Washoe County with nearby schools including Agnes Risley Elementary School, Sparks Middle School, and Sparks High School.
Ownership History
Date
Name
Owned For
Owner Type
Purchase Details
Closed on
Dec 26, 2001
Sold by
Sagarra Robert Craig and Sagarra Dianne M
Bought by
Fisher Max S and Fisher Hinemoa J
Current Estimated Value
Home Financials for this Owner
Home Financials are based on the most recent Mortgage that was taken out on this home.
Original Mortgage
$147,900
Outstanding Balance
$58,155
Interest Rate
6.51%
Estimated Equity
$380,576
Purchase Details
Closed on
Apr 19, 1995
Sold by
Barbarigos Marian D
Bought by
Sagarra Robert Craig and Sagarra Dianne M
Home Financials for this Owner
Home Financials are based on the most recent Mortgage that was taken out on this home.
Original Mortgage
$137,700
Interest Rate
8.44%
Mortgage Type
Assumption
Purchase Details
Closed on
Feb 10, 1994
Sold by
Barbarigos Marian D and Barbarigos Marian Dabney
Bought by
Barbarigos Marian D
Create a Home Valuation Report for This Property
The Home Valuation Report is an in-depth analysis detailing your home's value as well as a comparison with similar homes in the area
Home Values in the Area
Average Home Value in this Area
Purchase History
| Date | Buyer | Sale Price | Title Company |
|---|---|---|---|
| Fisher Max S | $152,500 | First American Title | |
| Sagarra Robert Craig | $135,000 | Western Title Company Inc | |
| Barbarigos Marian D | -- | Founders Title Company |
Source: Public Records
Mortgage History
| Date | Status | Borrower | Loan Amount |
|---|---|---|---|
| Open | Fisher Max S | $147,900 | |
| Previous Owner | Sagarra Robert Craig | $137,700 |
Source: Public Records
Tax History Compared to Growth
Tax History
| Year | Tax Paid | Tax Assessment Tax Assessment Total Assessment is a certain percentage of the fair market value that is determined by local assessors to be the total taxable value of land and additions on the property. | Land | Improvement |
|---|---|---|---|---|
| 2025 | $1,051 | $62,005 | $34,825 | $27,180 |
| 2024 | $1,021 | $56,996 | $30,205 | $26,791 |
| 2023 | $1,021 | $56,608 | $31,780 | $24,828 |
| 2022 | $992 | $47,399 | $27,160 | $20,239 |
| 2021 | $964 | $37,944 | $18,235 | $19,709 |
| 2020 | $934 | $37,186 | $17,850 | $19,336 |
| 2019 | $907 | $35,893 | $17,605 | $18,288 |
| 2018 | $881 | $29,895 | $12,355 | $17,540 |
| 2017 | $856 | $28,450 | $11,235 | $17,215 |
| 2016 | $834 | $27,019 | $9,765 | $17,254 |
| 2015 | $832 | $25,548 | $8,645 | $16,903 |
| 2014 | $809 | $22,248 | $6,335 | $15,913 |
| 2013 | -- | $21,549 | $4,900 | $16,649 |
Source: Public Records
Map
Nearby Homes
- 1780 Greenbrae Dr
- 1655 Byrd Dr
- 2154 Oppio St
- 1799 Vance Way
- 1365 Prospect Ave
- 1855 Verano Dr
- 1124 Sbragia Way
- 1595 York Way
- 1121 Greenbrae Dr
- 1841 Merchant St
- 1560 Steven Ct Unit 2
- 1889 Merchant St
- 1527 Steven Ct
- 1536 Irene Way
- 973 Damon Ln
- 1003 Sbragia Way
- 1110 Xman Way
- 1160 York Way
- 1345 Plymouth Way
- 1756 I St
- 1601 Meadowvale Way
- 1615 Meadowvale Way
- 1586 Greenbrae Dr Unit I
- 1600 Greenbrae Dr
- 1625 Meadowvale Way
- 1595 Meadowvale Way
- 1574 Greenbrae Dr
- 1610 Meadowvale Way Unit 2
- 1600 Meadowvale Way
- 1620 Meadowvale Way
- 1562 Greenbrae Dr
- 1630 Meadowvale Way
- 1634 Greenbrae Dr
- 1590 Meadowvale Way
- 1548 Greenbrae Dr
- 1571 Meadowvale Way
- 1640 Meadowvale Way
- 1655 Meadowvale Way
- 1775 Chloris Cir
- 1650 Greenbrae Dr