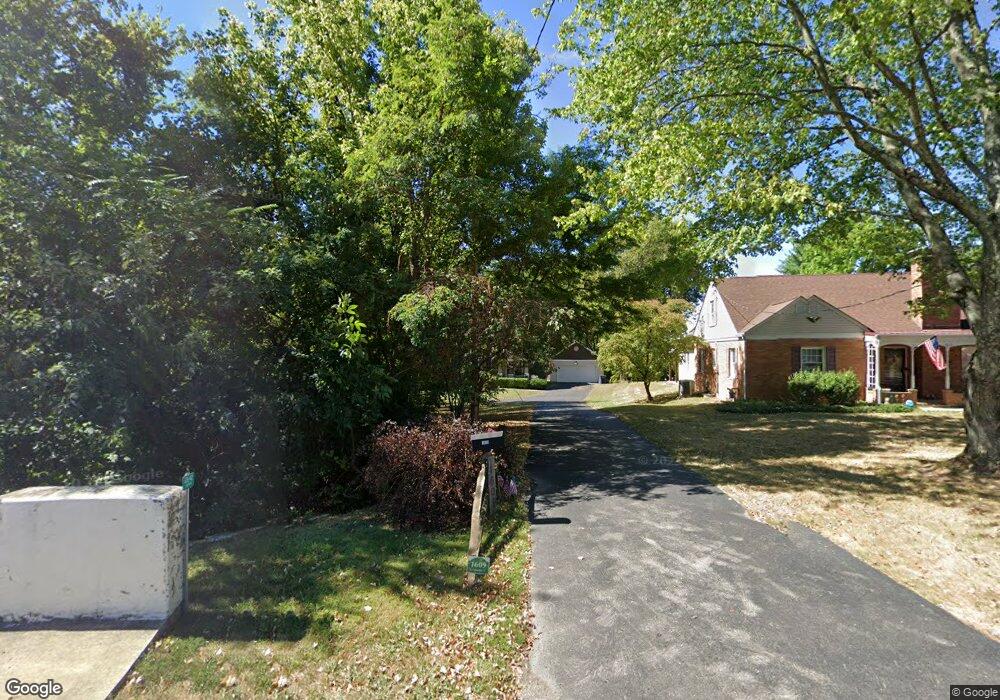
1609 N Columbus St Lancaster, OH 43130
Estimated Value: $330,000 - $422,000
3
Beds
3
Baths
1,428
Sq Ft
$269/Sq Ft
Est. Value
About This Home
This home is located at 1609 N Columbus St, Lancaster, OH 43130 and is currently estimated at $383,835, approximately $268 per square foot. 1609 N Columbus St is a home located in Fairfield County with nearby schools including Tarhe Elementary School, General Sherman Junior High School, and Lancaster High School.
Ownership History
Date
Name
Owned For
Owner Type
Purchase Details
Closed on
May 24, 2018
Sold by
Brooks Stuart
Bought by
Wagner Brian Keith and Wagner Susan Lynn
Current Estimated Value
Home Financials for this Owner
Home Financials are based on the most recent Mortgage that was taken out on this home.
Original Mortgage
$179,920
Outstanding Balance
$155,273
Interest Rate
4.5%
Mortgage Type
New Conventional
Estimated Equity
$228,562
Purchase Details
Closed on
Oct 26, 2006
Sold by
Fairfield Homes Inc
Bought by
Brooks Stuart
Home Financials for this Owner
Home Financials are based on the most recent Mortgage that was taken out on this home.
Original Mortgage
$152,000
Interest Rate
6.59%
Mortgage Type
Purchase Money Mortgage
Purchase Details
Closed on
Oct 19, 2005
Sold by
Hocking Valley Title Agency Inc
Bought by
Fairfield Homes Inc
Purchase Details
Closed on
Jul 29, 2004
Sold by
Wacker Paul W
Bought by
Fairfield Homes Inc
Create a Home Valuation Report for This Property
The Home Valuation Report is an in-depth analysis detailing your home's value as well as a comparison with similar homes in the area
Home Values in the Area
Average Home Value in this Area
Purchase History
| Date | Buyer | Sale Price | Title Company |
|---|---|---|---|
| Wagner Brian Keith | $224,750 | Valmer Land Title Agency Box | |
| Brooks Stuart | $197,000 | Hocking Valley Title Agency | |
| Fairfield Homes Inc | -- | -- | |
| Midwest Coin Laundry Inc | -- | -- | |
| Hocking Valley Title Agency Inc | -- | -- | |
| Fairfield Homes Inc | $30,000 | Hocking Valley Title Agency |
Source: Public Records
Mortgage History
| Date | Status | Borrower | Loan Amount |
|---|---|---|---|
| Open | Wagner Brian Keith | $179,920 | |
| Closed | Brooks Stuart | $152,000 |
Source: Public Records
Tax History Compared to Growth
Tax History
| Year | Tax Paid | Tax Assessment Tax Assessment Total Assessment is a certain percentage of the fair market value that is determined by local assessors to be the total taxable value of land and additions on the property. | Land | Improvement |
|---|---|---|---|---|
| 2024 | $9,604 | $106,830 | $27,640 | $79,190 |
| 2023 | $3,890 | $106,830 | $27,640 | $79,190 |
| 2022 | $3,767 | $103,090 | $27,640 | $75,450 |
| 2021 | $3,043 | $77,990 | $27,640 | $50,350 |
| 2020 | $2,916 | $77,990 | $27,640 | $50,350 |
| 2019 | $2,772 | $77,990 | $27,640 | $50,350 |
| 2018 | $3,009 | $69,760 | $26,320 | $43,440 |
| 2017 | $3,010 | $80,420 | $34,550 | $45,870 |
| 2016 | $2,932 | $80,420 | $34,550 | $45,870 |
| 2015 | $2,951 | $78,560 | $34,550 | $44,010 |
| 2014 | $2,811 | $78,560 | $34,550 | $44,010 |
| 2013 | $2,811 | $78,560 | $34,550 | $44,010 |
Source: Public Records
Map
Nearby Homes
- 0 Wacker Dr Unit 225036189
- 1511 N Columbus St
- 603 Edgewood Ave
- 0 Marks Ave Unit 225036443
- 1318 Graf St
- 189 Berkeley Dr
- 319 Greenfield Ave
- 1000 Goodwin Ave
- 815 Beacon St
- 226 Whittier Dr S
- 936 Harrison Ave
- 953 Garfield Ave
- 260 Scott Dr
- 1190 N Columbus St
- 315 Park St
- 844 Washington Ave
- 222 Park St
- 100 Wilson Ave
- 1410 W Fair Ave
- 628 Harrison Ave
- 1609 N Columbus St
- 1619 N Columbus St
- 202 Wildwood Ave
- 1623 N Columbus St
- 210 Wildwood Ave
- 1551 N Columbus St
- 1629 N Columbus St
- 1550 Graf St
- 1549 N Columbus St
- 1546 Graf St
- 1703 N Columbus St
- 211 S Pershing Dr
- 1600 N Columbus St
- 1540 Graf St
- 1618 N Columbus St
- 217 S Pershing Dr
- 1536 Graf St
- 1535 N Columbus St
- 1544 N Columbus St
- 214 S Pershing Dr