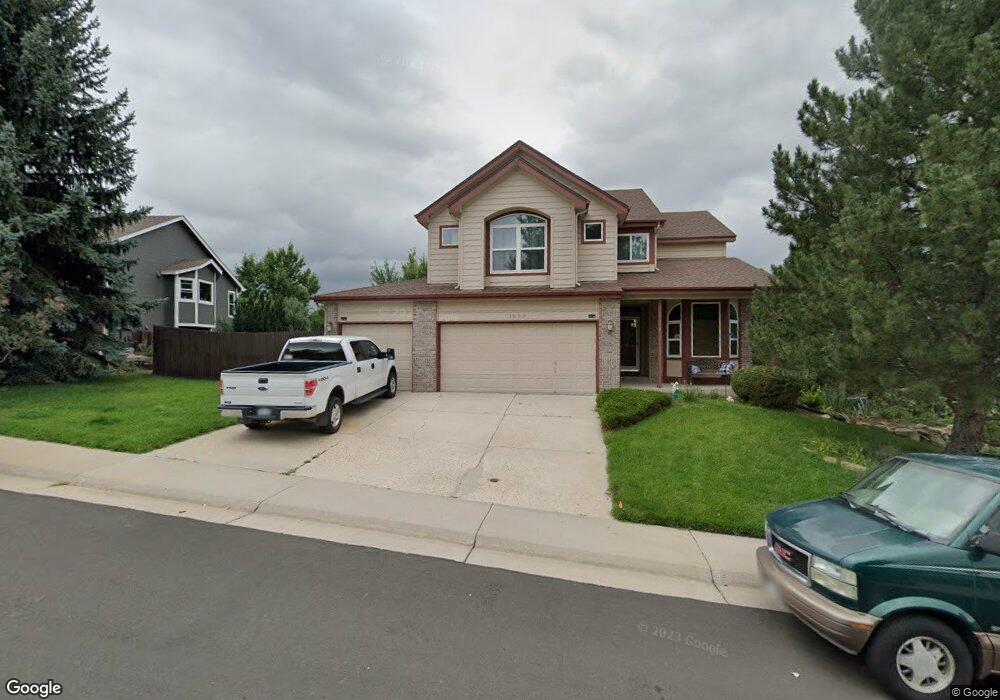
1609 Quail Ln Castle Rock, CO 80104
The Woodlands NeighborhoodEstimated Value: $629,777 - $717,000
3
Beds
4
Baths
1,991
Sq Ft
$331/Sq Ft
Est. Value
About This Home
This home is located at 1609 Quail Ln, Castle Rock, CO 80104 and is currently estimated at $659,694, approximately $331 per square foot. 1609 Quail Ln is a home located in Douglas County with nearby schools including Castle Rock Elementary School, Mesa Middle School, and Douglas County High School.
Ownership History
Date
Name
Owned For
Owner Type
Purchase Details
Closed on
Mar 18, 1994
Sold by
Renaissance Homes Of Saddlebrook
Bought by
Millington Daniel K and Millington Debra A
Current Estimated Value
Home Financials for this Owner
Home Financials are based on the most recent Mortgage that was taken out on this home.
Original Mortgage
$81,650
Interest Rate
6.96%
Purchase Details
Closed on
Oct 7, 1993
Sold by
Rowley Downs Land Co
Bought by
Renaissance Homes Saddlebrook
Purchase Details
Closed on
Sep 30, 1993
Sold by
Rowley Downs Land Co
Bought by
Renaissance Homes Saddlebrook
Purchase Details
Closed on
Mar 24, 1992
Sold by
C F Woodland Properties Inc
Bought by
Rowley Downs Land Co
Purchase Details
Closed on
Mar 28, 1989
Sold by
Commercial Fed Sav & Loan Assoc
Bought by
C F Woodland Properties Inc
Purchase Details
Closed on
Jan 26, 1987
Sold by
Talley Corporation
Bought by
Empire Savings Building & Loan Associati
Create a Home Valuation Report for This Property
The Home Valuation Report is an in-depth analysis detailing your home's value as well as a comparison with similar homes in the area
Home Values in the Area
Average Home Value in this Area
Purchase History
| Date | Buyer | Sale Price | Title Company |
|---|---|---|---|
| Millington Daniel K | $183,750 | -- | |
| Renaissance Homes Saddlebrook | $21,500 | -- | |
| Renaissance Homes Saddlebrook | $21,500 | -- | |
| Rowley Downs Land Co | -- | -- | |
| C F Woodland Properties Inc | -- | -- | |
| Empire Savings Building & Loan Associati | -- | -- |
Source: Public Records
Mortgage History
| Date | Status | Borrower | Loan Amount |
|---|---|---|---|
| Closed | Millington Daniel K | $81,650 |
Source: Public Records
Tax History Compared to Growth
Tax History
| Year | Tax Paid | Tax Assessment Tax Assessment Total Assessment is a certain percentage of the fair market value that is determined by local assessors to be the total taxable value of land and additions on the property. | Land | Improvement |
|---|---|---|---|---|
| 2024 | $2,804 | $44,160 | $9,950 | $34,210 |
| 2023 | $2,843 | $44,160 | $9,950 | $34,210 |
| 2022 | $1,991 | $29,880 | $7,180 | $22,700 |
| 2021 | $2,078 | $29,880 | $7,180 | $22,700 |
| 2020 | $2,375 | $29,460 | $5,990 | $23,470 |
| 2019 | $2,479 | $29,460 | $5,990 | $23,470 |
| 2018 | $2,271 | $26,440 | $4,600 | $21,840 |
| 2017 | $2,114 | $26,440 | $4,600 | $21,840 |
| 2016 | $1,965 | $24,050 | $4,300 | $19,750 |
| 2015 | $1,005 | $24,050 | $4,300 | $19,750 |
| 2014 | $1,852 | $20,510 | $3,980 | $16,530 |
Source: Public Records
Map
Nearby Homes
- 1387 Fox Canyon Ln
- 2596 Saddleback Dr
- 2111 Ramblewood Ct
- 2369 Bayberry Ln
- 993 Pleasant View St
- 2554 Saddleback Dr
- 1992 Woodbourne Terrace
- 2696 Castle Crest Dr
- 797 Canyon Dr Unit 797
- 19 Rock Ln
- 1008 Park View Ct
- 767 Canyon Dr Unit 767
- 717 Anderson St
- 1044 N Bader Ct
- 25 Oakridge Dr
- 336 Dawson Dr
- 419 Johnson Dr
- 601 Gilbert St
- 391 Burgess Dr
- 656 Sixth St