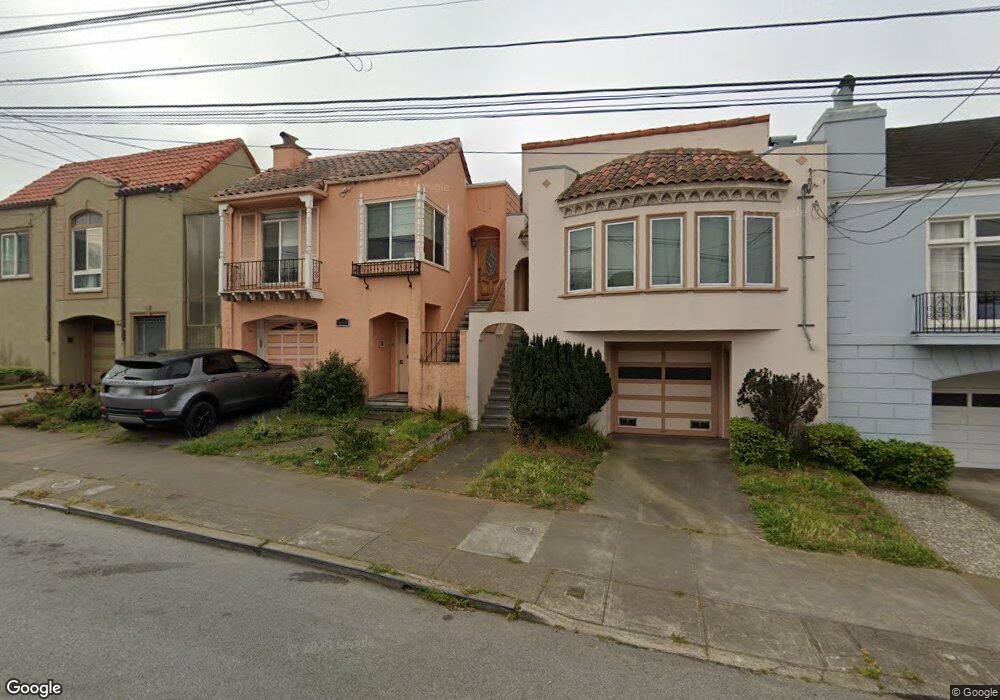
1609 Ulloa St San Francisco, CA 94116
Inner Parkside NeighborhoodEstimated Value: $1,586,000 - $2,120,000
4
Beds
4
Baths
2,180
Sq Ft
$884/Sq Ft
Est. Value
About This Home
This home is located at 1609 Ulloa St, San Francisco, CA 94116 and is currently estimated at $1,927,653, approximately $884 per square foot. 1609 Ulloa St is a home located in San Francisco County with nearby schools including West Portal Elementary School, Hoover (Herbert) Middle School, and St. Stephen School.
Ownership History
Date
Name
Owned For
Owner Type
Purchase Details
Closed on
Jan 31, 2008
Sold by
Wong Alicia
Bought by
Wong Heng Kit
Current Estimated Value
Home Financials for this Owner
Home Financials are based on the most recent Mortgage that was taken out on this home.
Original Mortgage
$849,000
Outstanding Balance
$537,204
Interest Rate
6.12%
Mortgage Type
Purchase Money Mortgage
Estimated Equity
$1,390,449
Purchase Details
Closed on
Jun 18, 2007
Sold by
Goodman Richard T
Bought by
Lee Elvis Kam Hung
Home Financials for this Owner
Home Financials are based on the most recent Mortgage that was taken out on this home.
Original Mortgage
$728,000
Interest Rate
6.75%
Mortgage Type
Purchase Money Mortgage
Purchase Details
Closed on
Jun 14, 2007
Sold by
Poon May Melyuk
Bought by
Lee Elvis Kam Hung
Home Financials for this Owner
Home Financials are based on the most recent Mortgage that was taken out on this home.
Original Mortgage
$728,000
Interest Rate
6.75%
Mortgage Type
Purchase Money Mortgage
Create a Home Valuation Report for This Property
The Home Valuation Report is an in-depth analysis detailing your home's value as well as a comparison with similar homes in the area
Home Values in the Area
Average Home Value in this Area
Purchase History
| Date | Buyer | Sale Price | Title Company |
|---|---|---|---|
| Wong Heng Kit | -- | First American Title Co | |
| Wong Heng Kit | $1,132,000 | First American Title Co | |
| Lee Elvis Kam Hung | $910,000 | First American Title Co | |
| Lee Elvis Kam Hung | -- | First American Title Co |
Source: Public Records
Mortgage History
| Date | Status | Borrower | Loan Amount |
|---|---|---|---|
| Open | Wong Heng Kit | $849,000 | |
| Previous Owner | Lee Elvis Kam Hung | $728,000 |
Source: Public Records
Tax History Compared to Growth
Tax History
| Year | Tax Paid | Tax Assessment Tax Assessment Total Assessment is a certain percentage of the fair market value that is determined by local assessors to be the total taxable value of land and additions on the property. | Land | Improvement |
|---|---|---|---|---|
| 2025 | $17,866 | $1,486,890 | $1,040,827 | $446,063 |
| 2024 | $17,866 | $1,457,736 | $1,020,419 | $437,317 |
| 2023 | $17,597 | $1,429,154 | $1,000,411 | $428,743 |
| 2022 | $17,262 | $1,401,133 | $980,796 | $420,337 |
| 2021 | $16,957 | $1,373,661 | $961,565 | $412,096 |
| 2020 | $17,084 | $1,359,577 | $951,706 | $407,871 |
| 2019 | $16,500 | $1,332,920 | $933,046 | $399,874 |
| 2018 | $15,941 | $1,306,785 | $914,751 | $392,034 |
| 2017 | $15,456 | $1,281,163 | $896,815 | $384,348 |
| 2016 | $15,203 | $1,256,043 | $879,231 | $376,812 |
| 2015 | $15,013 | $1,237,177 | $866,025 | $371,152 |
| 2014 | $14,618 | $1,212,943 | $849,061 | $363,882 |
Source: Public Records
Map
Nearby Homes
- 2543 16th Ave
- 2434 20th Ave
- 634-636 Taraval St
- 2418 20th Ave Unit 101
- 730 Santiago St
- 2292 16th Ave
- 2645 14th Ave
- 2279 14th Ave
- 2211 19th Ave
- 160 Wawona St
- 2790 19th Ave Unit 25
- 1414 Taraval St
- 353 Rivera St
- 2322 25th Ave
- 2116 18th Ave
- 17 Santa Monica Way
- 2123 Funston Ave
- 2262 26th Ave
- 2319 2321 21st Ave
- 1640 1644 Taraval St