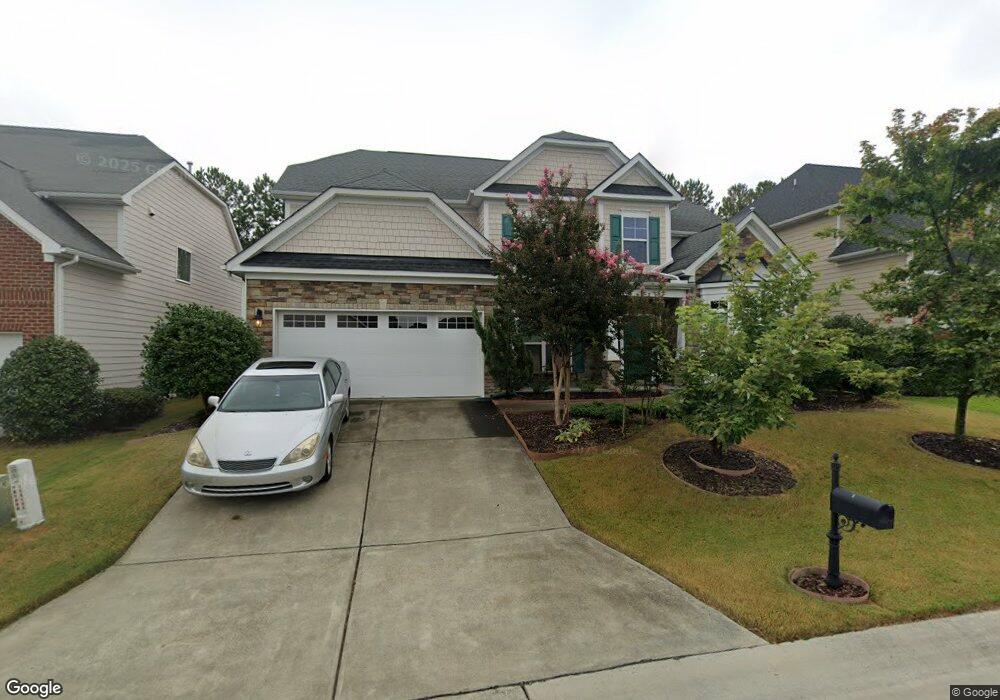
1609 Willowcrest Rd Durham, NC 27703
Eastern Durham NeighborhoodEstimated Value: $534,236 - $625,000
6
Beds
4
Baths
3,359
Sq Ft
$171/Sq Ft
Est. Value
About This Home
This home is located at 1609 Willowcrest Rd, Durham, NC 27703 and is currently estimated at $575,309, approximately $171 per square foot. 1609 Willowcrest Rd is a home located in Durham County with nearby schools including Spring Valley Elementary School, John W Neal Middle School, and Southern School of Energy & Sustainability.
Ownership History
Date
Name
Owned For
Owner Type
Purchase Details
Closed on
Jun 20, 2016
Sold by
Pertler Benjamin
Bought by
Miller Redell P and Miller Angela A
Current Estimated Value
Home Financials for this Owner
Home Financials are based on the most recent Mortgage that was taken out on this home.
Original Mortgage
$225,000
Outstanding Balance
$179,482
Interest Rate
3.64%
Estimated Equity
$395,827
Purchase Details
Closed on
Sep 10, 2014
Sold by
Speagle John and Speagle Nancy
Bought by
Pertler Benjamin and Pertler Kelliann
Home Financials for this Owner
Home Financials are based on the most recent Mortgage that was taken out on this home.
Original Mortgage
$240,000
Interest Rate
4.17%
Purchase Details
Closed on
May 18, 2012
Sold by
Hearthstone Multi Asset Entity B Lp
Bought by
Speagle John and Speagle Nancy
Create a Home Valuation Report for This Property
The Home Valuation Report is an in-depth analysis detailing your home's value as well as a comparison with similar homes in the area
Home Values in the Area
Average Home Value in this Area
Purchase History
| Date | Buyer | Sale Price | Title Company |
|---|---|---|---|
| Miller Redell P | $320,000 | -- | |
| Pertler Benjamin | $300,000 | None Available | |
| Speagle John | $262,500 | None Available |
Source: Public Records
Mortgage History
| Date | Status | Borrower | Loan Amount |
|---|---|---|---|
| Open | Miller Redell P | $225,000 | |
| Previous Owner | Pertler Benjamin | $240,000 |
Source: Public Records
Tax History
| Year | Tax Paid | Tax Assessment Tax Assessment Total Assessment is a certain percentage of the fair market value that is determined by local assessors to be the total taxable value of land and additions on the property. | Land | Improvement |
|---|---|---|---|---|
| 2025 | $5,381 | $542,847 | $98,600 | $444,247 |
| 2024 | $4,753 | $340,773 | $43,462 | $297,311 |
| 2023 | $4,464 | $340,773 | $43,462 | $297,311 |
| 2022 | $4,362 | $340,773 | $43,462 | $297,311 |
| 2021 | $4,341 | $340,773 | $43,462 | $297,311 |
| 2020 | $4,239 | $340,773 | $43,462 | $297,311 |
| 2019 | $4,239 | $340,773 | $43,462 | $297,311 |
| 2018 | $4,036 | $297,500 | $46,360 | $251,140 |
| 2017 | $4,006 | $297,500 | $46,360 | $251,140 |
| 2016 | $3,871 | $297,500 | $46,360 | $251,140 |
| 2015 | $4,170 | $301,237 | $34,947 | $266,290 |
| 2014 | $4,170 | $301,237 | $34,947 | $266,290 |
Source: Public Records
Map
Nearby Homes
- 124 Daneborg Rd
- 132 Daneborg Rd
- 142 Token House Rd
- 110 Elmsford St
- 407 Glenview Ln
- 1107 High Fox Dr
- 111 Glenview Ln
- 210 Hico Way
- 500 Kings Lake Way
- 533 Kings Lake Way
- 3311 Delmar Dr
- 1821 S Mineral Springs Rd
- 1607 Eagle Lodge Ln
- 938 McLamb Dr
- 610 Sherron Rd
- 928 Danbury Dr
- 3150 Gypsum Dr
- 3204 Gypsum Dr
- 3208 Gypsum Dr
- 3210 Gypsum Dr
- 1701 Willowcrest Rd
- 1607 Willowcrest Rd
- 1703 Willowcrest Rd
- 1605 Willowcrest Rd
- 131 Daneborg Rd
- 133 Daneborg Rd
- 129 Daneborg Rd
- 135 Daneborg Rd
- 127 Daneborg Rd
- 103 Windrush Ln
- 1705 Willowcrest Rd
- 1603 Willowcrest Rd
- 125 Daneborg Rd
- 137 Daneborg Rd
- 104 Windrush Ln
- 105 Windrush Ln
- 201 Ashton Glen
- 123 Daneborg Rd
- 139 Daneborg Rd
Your Personal Tour Guide
Ask me questions while you tour the home.