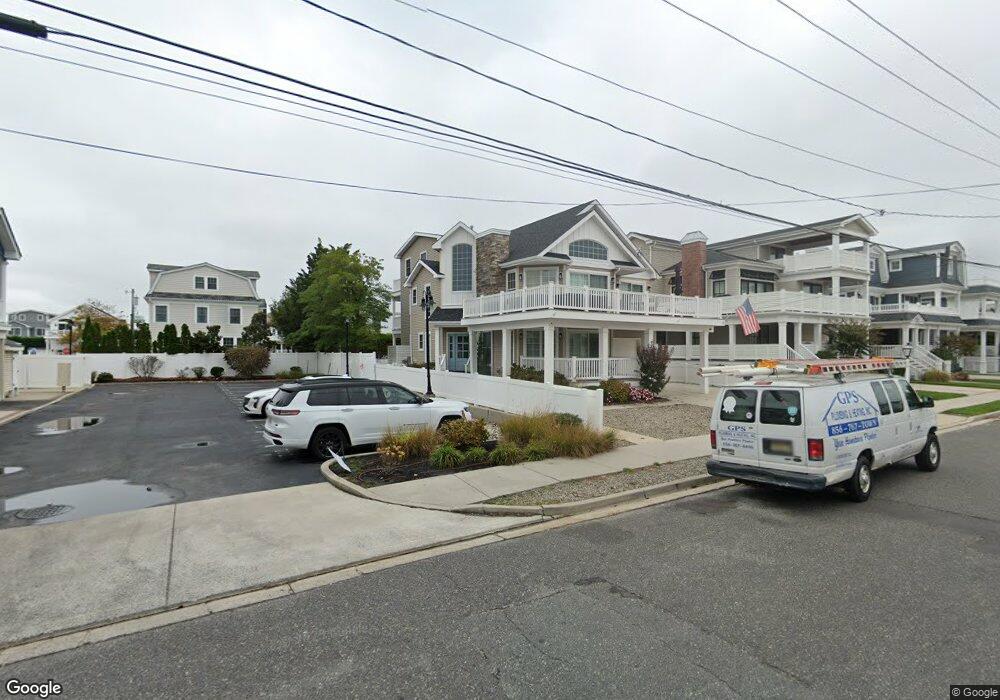
161 21st St Avalon, NJ 08202
Estimated Value: $2,966,000 - $4,180,000
--
Bed
--
Bath
3,419
Sq Ft
$1,054/Sq Ft
Est. Value
About This Home
This home is located at 161 21st St, Avalon, NJ 08202 and is currently estimated at $3,602,126, approximately $1,053 per square foot. 161 21st St is a home located in Cape May County with nearby schools including Avalon Elementary School.
Ownership History
Date
Name
Owned For
Owner Type
Purchase Details
Closed on
Feb 12, 2013
Sold by
Walter John H
Bought by
Kiernan James T
Current Estimated Value
Home Financials for this Owner
Home Financials are based on the most recent Mortgage that was taken out on this home.
Original Mortgage
$375,000
Outstanding Balance
$252,372
Interest Rate
2.62%
Mortgage Type
Adjustable Rate Mortgage/ARM
Estimated Equity
$3,349,754
Create a Home Valuation Report for This Property
The Home Valuation Report is an in-depth analysis detailing your home's value as well as a comparison with similar homes in the area
Home Values in the Area
Average Home Value in this Area
Purchase History
| Date | Buyer | Sale Price | Title Company |
|---|---|---|---|
| Kiernan James T | $1,100,000 | Seaboard Title Agency |
Source: Public Records
Mortgage History
| Date | Status | Borrower | Loan Amount |
|---|---|---|---|
| Open | Kiernan James T | $375,000 |
Source: Public Records
Tax History Compared to Growth
Tax History
| Year | Tax Paid | Tax Assessment Tax Assessment Total Assessment is a certain percentage of the fair market value that is determined by local assessors to be the total taxable value of land and additions on the property. | Land | Improvement |
|---|---|---|---|---|
| 2025 | $10,002 | $1,629,000 | $810,000 | $819,000 |
| 2024 | $10,002 | $1,629,000 | $810,000 | $819,000 |
| 2023 | $9,921 | $1,629,000 | $810,000 | $819,000 |
| 2022 | $9,253 | $1,629,000 | $810,000 | $819,000 |
| 2021 | $8,911 | $1,629,000 | $810,000 | $819,000 |
| 2020 | $8,569 | $1,629,000 | $810,000 | $819,000 |
| 2019 | $8,308 | $1,629,000 | $810,000 | $819,000 |
| 2018 | $7,950 | $1,629,000 | $810,000 | $819,000 |
| 2017 | $7,665 | $1,378,600 | $630,000 | $748,600 |
| 2016 | $7,582 | $1,378,600 | $630,000 | $748,600 |
| 2015 | $7,458 | $1,378,600 | $630,000 | $748,600 |
| 2014 | $7,376 | $1,378,600 | $630,000 | $748,600 |
Source: Public Records
Map
Nearby Homes