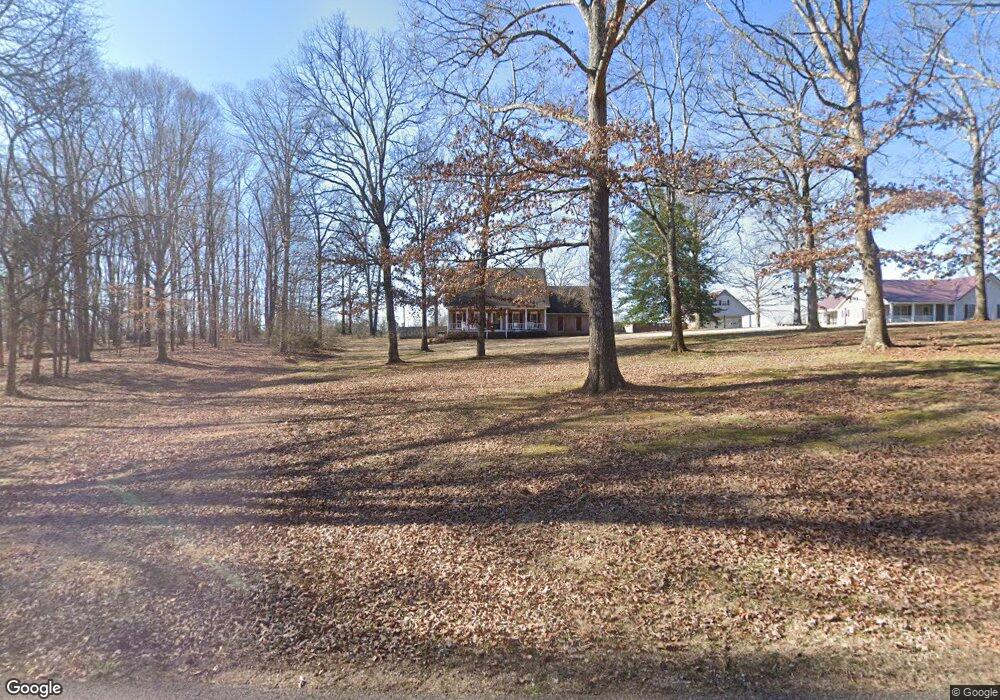
161 Allison Ln Savannah, TN 38372
Estimated Value: $348,000 - $400,000
--
Bed
4
Baths
2,928
Sq Ft
$127/Sq Ft
Est. Value
About This Home
This home is located at 161 Allison Ln, Savannah, TN 38372 and is currently estimated at $371,467, approximately $126 per square foot. 161 Allison Ln is a home located in Hardin County with nearby schools including Hardin County High School and Hardin County Christian School.
Ownership History
Date
Name
Owned For
Owner Type
Purchase Details
Closed on
Sep 12, 2016
Sold by
Evans Micah J
Bought by
Evans Michelle H
Current Estimated Value
Home Financials for this Owner
Home Financials are based on the most recent Mortgage that was taken out on this home.
Original Mortgage
$257,266
Interest Rate
3.45%
Mortgage Type
New Conventional
Purchase Details
Closed on
Oct 4, 2002
Sold by
Stricklin Martin J
Bought by
Evans Micah J
Purchase Details
Closed on
Feb 2, 1998
Sold by
French Larry W
Bought by
Martin Stricklin
Purchase Details
Closed on
Jul 30, 1993
Bought by
French Larry W and French Pamela
Purchase Details
Closed on
Aug 6, 1990
Bought by
Godwin Tony and Godwin Janice
Purchase Details
Closed on
Jan 23, 1989
Bought by
Godwin Tony and Godwin Janice
Purchase Details
Closed on
Oct 5, 1988
Bought by
Webb Webb R and Webb Cleo
Purchase Details
Closed on
Dec 14, 1987
Bought by
S & S Asphalt Corporation Of Lexington T
Purchase Details
Closed on
Dec 31, 1935
Bought by
Allison Fannie B
Create a Home Valuation Report for This Property
The Home Valuation Report is an in-depth analysis detailing your home's value as well as a comparison with similar homes in the area
Home Values in the Area
Average Home Value in this Area
Purchase History
| Date | Buyer | Sale Price | Title Company |
|---|---|---|---|
| Evans Michelle H | -- | -- | |
| Evans Micah J | $148,900 | -- | |
| Martin Stricklin | $112,000 | -- | |
| French Larry W | $101,500 | -- | |
| Godwin Tony | -- | -- | |
| Godwin Tony | -- | -- | |
| Webb Webb R | -- | -- | |
| S & S Asphalt Corporation Of Lexington T | -- | -- | |
| Allison Fannie B | -- | -- |
Source: Public Records
Mortgage History
| Date | Status | Borrower | Loan Amount |
|---|---|---|---|
| Closed | Evans Michelle H | $257,266 |
Source: Public Records
Tax History Compared to Growth
Tax History
| Year | Tax Paid | Tax Assessment Tax Assessment Total Assessment is a certain percentage of the fair market value that is determined by local assessors to be the total taxable value of land and additions on the property. | Land | Improvement |
|---|---|---|---|---|
| 2024 | $1,426 | $81,475 | $7,900 | $73,575 |
| 2023 | $1,426 | $81,475 | $7,900 | $73,575 |
| 2022 | $1,046 | $50,775 | $4,575 | $46,200 |
| 2021 | $1,046 | $50,775 | $4,575 | $46,200 |
| 2020 | $1,046 | $50,775 | $4,575 | $46,200 |
| 2019 | $1,046 | $50,775 | $4,575 | $46,200 |
| 2018 | $1,011 | $50,775 | $4,575 | $46,200 |
| 2017 | $1,047 | $50,350 | $4,575 | $45,775 |
| 2016 | $1,047 | $50,350 | $4,575 | $45,775 |
| 2015 | $916 | $50,350 | $4,575 | $45,775 |
| 2014 | $916 | $50,350 | $4,575 | $45,775 |
Source: Public Records
Map
Nearby Homes
- 95 Cedar Cove Ln
- 5115 Tennessee 226
- 0 Cordova Cove
- 0 Cordova Cove
- LOT 17 Cordova Cove
- 1820 Pinhook Rd
- LOT 34 Cordova Cove
- 225 Cordova Cove
- 850 Cordova Cove
- 470 Olivet Dr
- 6170 Tennessee 226
- 134 Horse Creek Rd
- 145 Tom Way
- 210 Trinity Cir
- 460 Andrews Ln
- 00 Squaw St
- 41 Bartley Dr
- 30 Rodeo Way
- 280 Meadowlane Dr
- 115 Partridge Ln
- 195 Allison Ln
- 190 Allison Ln
- 120 Allison Ln
- 245 Allison Ln
- 250 Allison Ln
- 5505 Highway 226
- 256 Roy Crunk Ln
- 317 Allison Ln
- 280 Roy Crunk Ln
- 165 Roy Crunk Ln
- 290 Roy Crunk Ln Unit 300
- 145 Roy Crunk Ln
- 26 Allison Ln
- 105 Roy Crunk Ln
- 125 Roy Crunk Ln
- 5705 Highway 226
- 215 Roy Crunk Ln Unit 225
- 245 Roy Crunk Ln
- 175 Cedar Cove Ln
- 155 Cedar Cove Ln