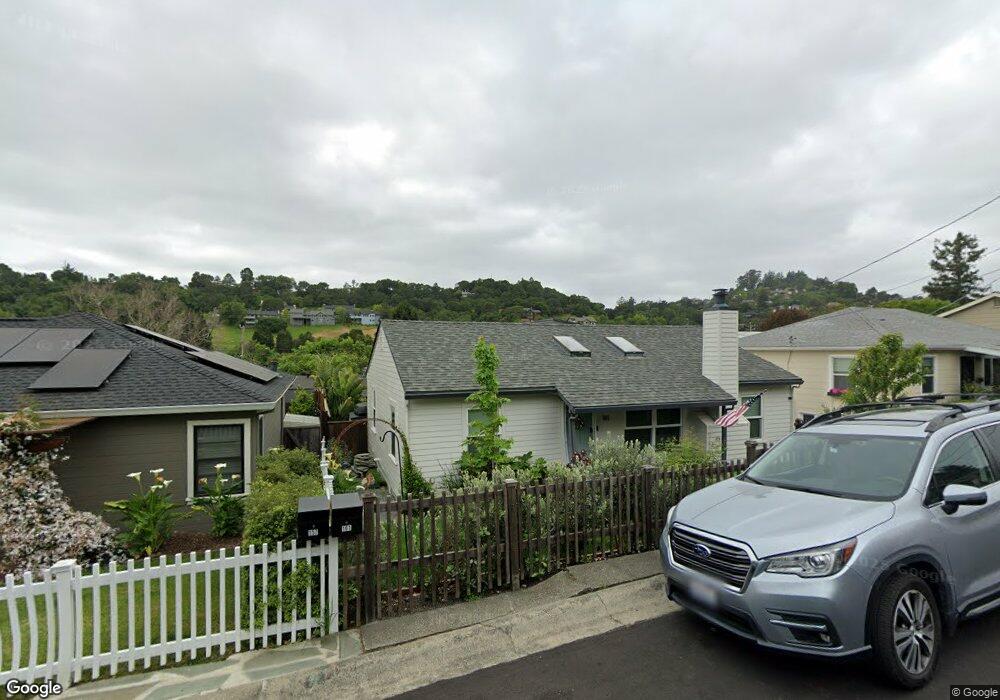
161 Alpine St San Rafael, CA 94901
Sun Valley NeighborhoodEstimated Value: $1,054,486
3
Beds
2
Baths
1,308
Sq Ft
$806/Sq Ft
Est. Value
About This Home
This home is located at 161 Alpine St, San Rafael, CA 94901 and is currently estimated at $1,054,486, approximately $806 per square foot. 161 Alpine St is a home located in Marin County with nearby schools including Sun Valley Elementary School, James B. Davidson Middle School, and San Rafael High School.
Ownership History
Date
Name
Owned For
Owner Type
Purchase Details
Closed on
Jan 4, 2017
Sold by
Babcock Richard M and Weston Margaret
Bought by
Fitzsimmons William and Fitzsimmons Chelsea
Current Estimated Value
Home Financials for this Owner
Home Financials are based on the most recent Mortgage that was taken out on this home.
Original Mortgage
$610,000
Outstanding Balance
$502,121
Interest Rate
4.08%
Mortgage Type
New Conventional
Estimated Equity
$552,365
Purchase Details
Closed on
Nov 19, 2014
Sold by
Babcock Richard M
Bought by
Babcock Richard M and Weston Margaret
Home Financials for this Owner
Home Financials are based on the most recent Mortgage that was taken out on this home.
Original Mortgage
$541,300
Interest Rate
4.1%
Mortgage Type
New Conventional
Purchase Details
Closed on
May 17, 2012
Sold by
Vanvandoren Rebecca Van
Bought by
Babcock Richard M
Purchase Details
Closed on
Apr 21, 2011
Sold by
Vandoren Rebecca
Bought by
Vandoren Rebecca
Purchase Details
Closed on
Nov 25, 2009
Sold by
Boyd Mitchell S and Boyd Natalie
Bought by
Vandoren Rebecca and Babcock Richard M
Home Financials for this Owner
Home Financials are based on the most recent Mortgage that was taken out on this home.
Original Mortgage
$580,687
Interest Rate
4.99%
Mortgage Type
FHA
Purchase Details
Closed on
Jan 5, 2007
Sold by
Boyd Mitchell S and Deutsch Natalie
Bought by
Boyd Mitchell S and Deutsch Natalie
Home Financials for this Owner
Home Financials are based on the most recent Mortgage that was taken out on this home.
Original Mortgage
$367,000
Interest Rate
6.12%
Mortgage Type
Purchase Money Mortgage
Purchase Details
Closed on
Jan 3, 2007
Sold by
Black Betsey B
Bought by
Boyd Mitch and Deutsch Natalie
Home Financials for this Owner
Home Financials are based on the most recent Mortgage that was taken out on this home.
Original Mortgage
$367,000
Interest Rate
6.12%
Mortgage Type
Purchase Money Mortgage
Purchase Details
Closed on
Dec 7, 1998
Sold by
Black Betsey B
Bought by
Black Betsey B
Create a Home Valuation Report for This Property
The Home Valuation Report is an in-depth analysis detailing your home's value as well as a comparison with similar homes in the area
Home Values in the Area
Average Home Value in this Area
Purchase History
| Date | Buyer | Sale Price | Title Company |
|---|---|---|---|
| Fitzsimmons William | $815,000 | Old Republic Title Co | |
| Babcock Richard M | $271,000 | Old Republic Title Company | |
| Babcock Richard M | $19,000 | Old Republic Title Company | |
| Vandoren Rebecca | -- | None Available | |
| Vandoren Rebecca | $623,000 | Fidelity National Title Co | |
| Boyd Mitchell S | -- | Accommodation | |
| Boyd Mitch | $650,000 | Fidelity National Title Co | |
| Black Betsey B | -- | -- |
Source: Public Records
Mortgage History
| Date | Status | Borrower | Loan Amount |
|---|---|---|---|
| Open | Fitzsimmons William | $610,000 | |
| Previous Owner | Babcock Richard M | $541,300 | |
| Previous Owner | Vandoren Rebecca | $580,687 | |
| Previous Owner | Boyd Mitch | $367,000 |
Source: Public Records
Tax History
| Year | Tax Paid | Tax Assessment Tax Assessment Total Assessment is a certain percentage of the fair market value that is determined by local assessors to be the total taxable value of land and additions on the property. | Land | Improvement |
|---|---|---|---|---|
| 2025 | $13,144 | $1,085,409 | $597,688 | $487,721 |
| 2024 | $12,830 | $1,064,133 | $585,972 | $478,161 |
| 2023 | $14,543 | $1,043,268 | $574,482 | $468,786 |
| 2022 | $13,739 | $1,022,814 | $563,219 | $459,595 |
| 2021 | $13,520 | $1,002,761 | $552,177 | $450,584 |
| 2020 | $12,433 | $908,816 | $546,518 | $362,298 |
| 2019 | $11,501 | $846,885 | $535,806 | $311,079 |
| 2018 | $11,386 | $830,280 | $525,300 | $304,980 |
| 2017 | $9,428 | $690,185 | $444,671 | $245,514 |
| 2016 | $9,113 | $676,654 | $435,953 | $240,701 |
| 2015 | $8,355 | $634,495 | $429,408 | $205,087 |
| 2014 | $7,901 | $612,266 | $420,999 | $191,267 |
Source: Public Records
Map
Nearby Homes
Your Personal Tour Guide
Ask me questions while you tour the home.