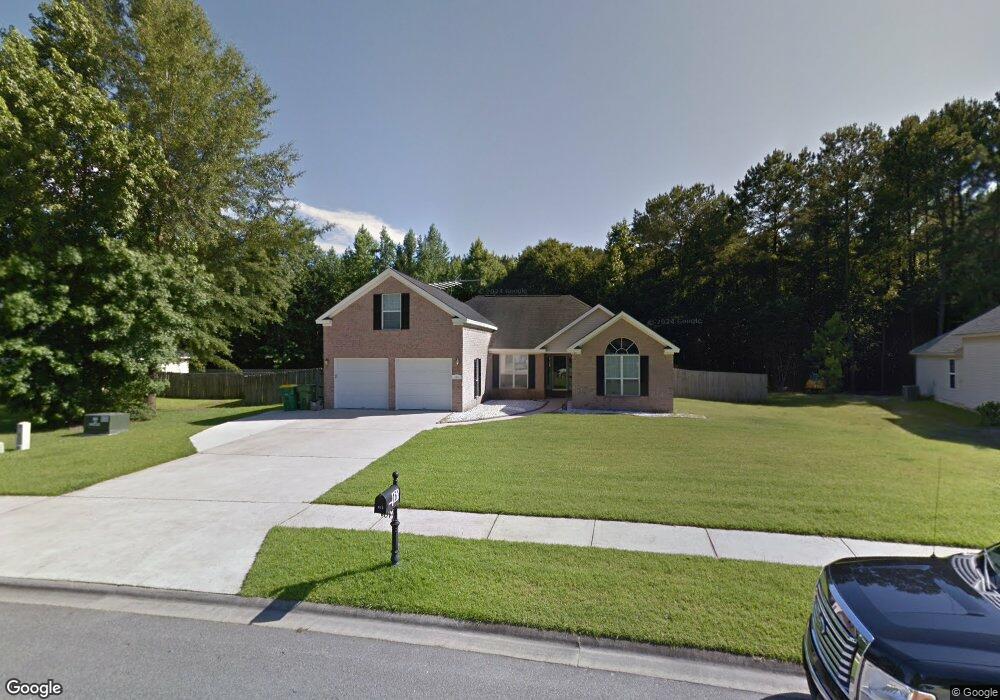
161 Brooklyn Way Pooler, GA 31322
Estimated Value: $389,000 - $422,000
4
Beds
3
Baths
2,333
Sq Ft
$174/Sq Ft
Est. Value
About This Home
This home is located at 161 Brooklyn Way, Pooler, GA 31322 and is currently estimated at $405,829, approximately $173 per square foot. 161 Brooklyn Way is a home located in Chatham County with nearby schools including West Chatham Elementary School, West Chatham Middle School, and New Hampstead High School.
Ownership History
Date
Name
Owned For
Owner Type
Purchase Details
Closed on
Mar 3, 2022
Sold by
Brown Ulysses J
Bought by
Brown Ulysses J and Brown Chevanese Samms
Current Estimated Value
Home Financials for this Owner
Home Financials are based on the most recent Mortgage that was taken out on this home.
Original Mortgage
$250,000
Outstanding Balance
$232,967
Interest Rate
3.69%
Mortgage Type
VA
Estimated Equity
$172,862
Purchase Details
Closed on
Mar 31, 2005
Sold by
Not Provided
Bought by
Brown Ulysses J
Home Financials for this Owner
Home Financials are based on the most recent Mortgage that was taken out on this home.
Original Mortgage
$229,288
Interest Rate
5.74%
Mortgage Type
New Conventional
Purchase Details
Closed on
Jul 29, 2004
Sold by
Regal Builders Of The Coastal Empire Llc
Bought by
Northcutt Keith L and Northcutt Kenyetta S
Create a Home Valuation Report for This Property
The Home Valuation Report is an in-depth analysis detailing your home's value as well as a comparison with similar homes in the area
Home Values in the Area
Average Home Value in this Area
Purchase History
| Date | Buyer | Sale Price | Title Company |
|---|---|---|---|
| Brown Ulysses J | -- | -- | |
| Brown Ulysses J | $225,900 | -- | |
| Northcutt Keith L | $180,800 | -- |
Source: Public Records
Mortgage History
| Date | Status | Borrower | Loan Amount |
|---|---|---|---|
| Open | Brown Ulysses J | $250,000 | |
| Previous Owner | Brown Ulysses J | $229,288 |
Source: Public Records
Tax History
| Year | Tax Paid | Tax Assessment Tax Assessment Total Assessment is a certain percentage of the fair market value that is determined by local assessors to be the total taxable value of land and additions on the property. | Land | Improvement |
|---|---|---|---|---|
| 2025 | $5,276 | $163,000 | $20,000 | $143,000 |
| 2024 | $50 | $161,800 | $20,000 | $141,800 |
| 2023 | $5,008 | $156,840 | $10,000 | $146,840 |
| 2022 | $4,265 | $142,680 | $10,000 | $132,680 |
| 2021 | $4,655 | $124,440 | $10,000 | $114,440 |
| 2020 | $3,419 | $102,280 | $10,000 | $92,280 |
| 2019 | $3,419 | $100,040 | $10,000 | $90,040 |
| 2018 | $3,306 | $96,600 | $10,000 | $86,600 |
| 2017 | $3,106 | $97,000 | $10,000 | $87,000 |
| 2016 | $3,075 | $95,840 | $10,000 | $85,840 |
| 2015 | $3,062 | $94,960 | $10,000 | $84,960 |
| 2014 | $3,985 | $85,760 | $0 | $0 |
Source: Public Records
Map
Nearby Homes
- Dayton Plan at Harmony
- Crestview Plan at Harmony
- Spring Valley II Plan at Harmony
- Stillwater Plan at Harmony
- Spring Mountain II Plan at Harmony
- Brookline Plan at Harmony
- Pinehurst II Plan at Harmony
- Roxboro Plan at Harmony
- Avery Plan at Harmony
- Richmond Plan at Harmony
- 8 Sundance Ct
- 146 Sonata Cir
- 100 Sonata Cir
- 10 Mackinac Ct
- 172 Sonata Cir
- 125 Acapella Ave
- 7 Tranquil Place
- 224 Opus Ct
- 226 Opus Ct
- 33 Woodford Reserve Dr
- 159 Brooklyn Way
- 163 Brooklyn Way
- 157 Brooklyn Way
- 165 Brooklyn Way
- 162 Brooklyn Way
- 158 Brooklyn Way
- 164 Brooklyn Way
- 167 Brooklyn Way
- 156 Brooklyn Way
- 166 Brooklyn Way
- 155 Brooklyn Way
- 154 Brooklyn Way
- 9 Scott Key Ct
- 153 Brooklyn Way
- 7 Scott Key Ct
- 8 Scott Key Ct
- 152 Brooklyn Way
- 2502 Quacco Rd
- 13 London Tower Ct
- 8 London Tower Ct