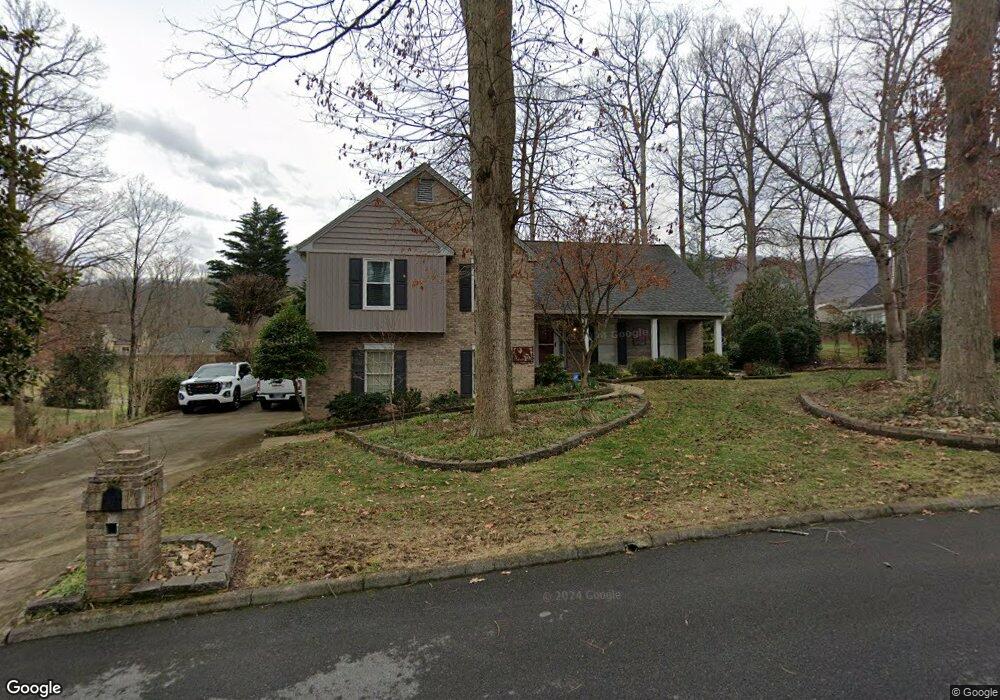
161 Chippendale Square Kingsport, TN 37660
Estimated Value: $484,000 - $614,000
4
Beds
4
Baths
3,353
Sq Ft
$164/Sq Ft
Est. Value
About This Home
This home is located at 161 Chippendale Square, Kingsport, TN 37660 and is currently estimated at $550,959, approximately $164 per square foot. 161 Chippendale Square is a home located in Sullivan County with nearby schools including George Washington Elementary School, John Sevier Middle School, and Ross N. Robinson Middle School.
Ownership History
Date
Name
Owned For
Owner Type
Purchase Details
Closed on
Aug 24, 2011
Sold by
Pannell Robert W
Bought by
Ratcliffe Curtis Lee
Current Estimated Value
Purchase Details
Closed on
Sep 16, 2009
Sold by
Pannell Robert W
Bought by
Pannell Robert W
Purchase Details
Closed on
Jun 24, 2004
Sold by
Arnold Cynthia A
Bought by
Pannell Robert W
Purchase Details
Closed on
Apr 29, 2003
Sold by
Pascal Convers
Bought by
Arnold Cynthia A
Home Financials for this Owner
Home Financials are based on the most recent Mortgage that was taken out on this home.
Original Mortgage
$228,000
Interest Rate
5.76%
Purchase Details
Closed on
Jun 4, 2002
Sold by
Luiz Siqueira and Luiz Edith
Bought by
Pascal Convers
Home Financials for this Owner
Home Financials are based on the most recent Mortgage that was taken out on this home.
Original Mortgage
$200,000
Interest Rate
6.77%
Purchase Details
Closed on
Dec 8, 1998
Sold by
Thomas Theodore J
Bought by
Jose Siqueira
Create a Home Valuation Report for This Property
The Home Valuation Report is an in-depth analysis detailing your home's value as well as a comparison with similar homes in the area
Home Values in the Area
Average Home Value in this Area
Purchase History
| Date | Buyer | Sale Price | Title Company |
|---|---|---|---|
| Ratcliffe Curtis Lee | $285,000 | -- | |
| Pannell Robert W | -- | -- | |
| Pannell Robert W | $269,900 | -- | |
| Arnold Cynthia A | $285,000 | -- | |
| Pascal Convers | $265,000 | -- | |
| Jose Siqueira | $210,770 | -- |
Source: Public Records
Mortgage History
| Date | Status | Borrower | Loan Amount |
|---|---|---|---|
| Previous Owner | Jose Siqueira | $228,000 | |
| Previous Owner | Jose Siqueira | $200,000 |
Source: Public Records
Tax History Compared to Growth
Tax History
| Year | Tax Paid | Tax Assessment Tax Assessment Total Assessment is a certain percentage of the fair market value that is determined by local assessors to be the total taxable value of land and additions on the property. | Land | Improvement |
|---|---|---|---|---|
| 2024 | -- | $72,900 | $11,525 | $61,375 |
| 2023 | $3,211 | $72,900 | $11,525 | $61,375 |
| 2022 | $3,211 | $72,900 | $11,525 | $61,375 |
| 2021 | $3,123 | $72,900 | $11,525 | $61,375 |
| 2020 | $1,812 | $72,900 | $11,525 | $61,375 |
| 2019 | $3,267 | $70,500 | $11,525 | $58,975 |
| 2018 | $3,190 | $70,500 | $11,525 | $58,975 |
| 2017 | $3,190 | $70,500 | $11,525 | $58,975 |
| 2016 | $3,287 | $70,750 | $11,525 | $59,225 |
| 2014 | -- | $70,752 | $0 | $0 |
Source: Public Records
Map
Nearby Homes
- 544 Fleetwood Dr Unit F
- 2069 Canterbury Rd
- 404 Manor Dr Unit C
- 708 Thornwood Place
- Tbd Ridgefields Rd
- 1801 Manor Ct Unit B
- 1833 Manor Ct
- 421 High Ridge Rd
- 461 Eastley Ct Unit 5
- 416 Ridgefields Rd
- 1917 Birchfield Pvt Ct
- 517 Forestdale Rd
- 200 River Edge Dr
- 305 Pleasley Rd
- 1000 Amersham Rd
- 252 River Edge Dr
- 1020 Boyd Path Ct
- 1024 Boyd Path Ct
- TBD Kings Bay Dr
- 2424 Rivermont Dr
- 825 Ridgefields Rd
- 829 Ridgefields Rd
- 715 Chippendale Rd
- 153 Chippendale Square
- 821 Ridgefields Rd
- 152 Chippendale Square
- 833 Ridgefields Rd
- 100 Chippendale Square
- 708 Chippendale Rd
- 704 Chippendale Rd
- 717 Chippendale Rd
- 148 Chippendale Square
- 712 Chippendale Rd
- 137 Chippendale Square
- 104 Chippendale Square
- 824 Ridgefields Rd
- 817 Ridgefields Rd
- 820 Ridgefields Rd
- 145 Chippendale Square
- 160 Chippendale Square