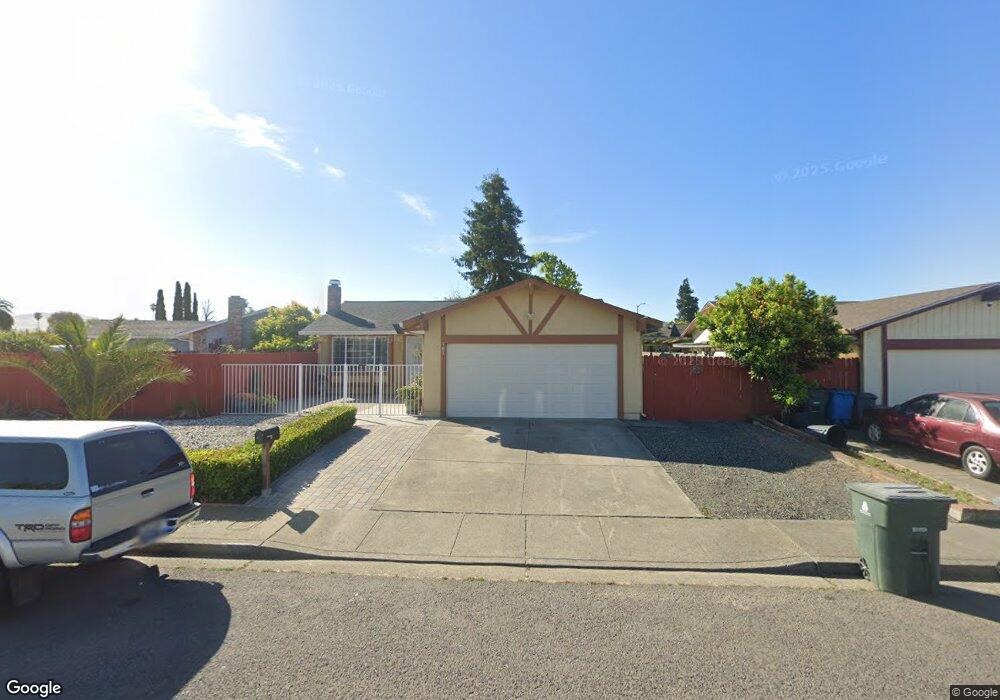
161 Coloma Way Vallejo, CA 94589
North Vallejo NeighborhoodEstimated Value: $469,000 - $515,000
3
Beds
2
Baths
1,144
Sq Ft
$434/Sq Ft
Est. Value
About This Home
This home is located at 161 Coloma Way, Vallejo, CA 94589 and is currently estimated at $496,455, approximately $433 per square foot. 161 Coloma Way is a home located in Solano County with nearby schools including Dan Mini Elementary School, Solano Middle School, and Vallejo High School.
Ownership History
Date
Name
Owned For
Owner Type
Purchase Details
Closed on
Aug 31, 2015
Sold by
Brar Sadhu Singh and Brar Surinder Kaur
Bought by
Galvez Giovanni and Galvez Rebecca
Current Estimated Value
Home Financials for this Owner
Home Financials are based on the most recent Mortgage that was taken out on this home.
Original Mortgage
$244,200
Outstanding Balance
$196,324
Interest Rate
4.62%
Mortgage Type
FHA
Estimated Equity
$300,131
Create a Home Valuation Report for This Property
The Home Valuation Report is an in-depth analysis detailing your home's value as well as a comparison with similar homes in the area
Home Values in the Area
Average Home Value in this Area
Purchase History
| Date | Buyer | Sale Price | Title Company |
|---|---|---|---|
| Galvez Giovanni | $300,000 | Old Republic Title Co |
Source: Public Records
Mortgage History
| Date | Status | Borrower | Loan Amount |
|---|---|---|---|
| Open | Galvez Giovanni | $244,200 |
Source: Public Records
Tax History Compared to Growth
Tax History
| Year | Tax Paid | Tax Assessment Tax Assessment Total Assessment is a certain percentage of the fair market value that is determined by local assessors to be the total taxable value of land and additions on the property. | Land | Improvement |
|---|---|---|---|---|
| 2025 | $4,993 | $355,132 | $88,781 | $266,351 |
| 2024 | $4,993 | $348,170 | $87,041 | $261,129 |
| 2023 | $4,713 | $341,344 | $85,335 | $256,009 |
| 2022 | $4,622 | $334,652 | $83,662 | $250,990 |
| 2021 | $4,519 | $328,091 | $82,022 | $246,069 |
| 2020 | $4,544 | $324,727 | $81,181 | $243,546 |
| 2019 | $4,409 | $318,361 | $79,590 | $238,771 |
| 2018 | $4,130 | $312,120 | $78,030 | $234,090 |
| 2017 | $3,950 | $306,000 | $76,500 | $229,500 |
| 2016 | $3,396 | $300,000 | $75,000 | $225,000 |
| 2015 | $1,286 | $108,691 | $32,607 | $76,084 |
| 2014 | $1,269 | $106,563 | $31,969 | $74,594 |
Source: Public Records
Map
Nearby Homes