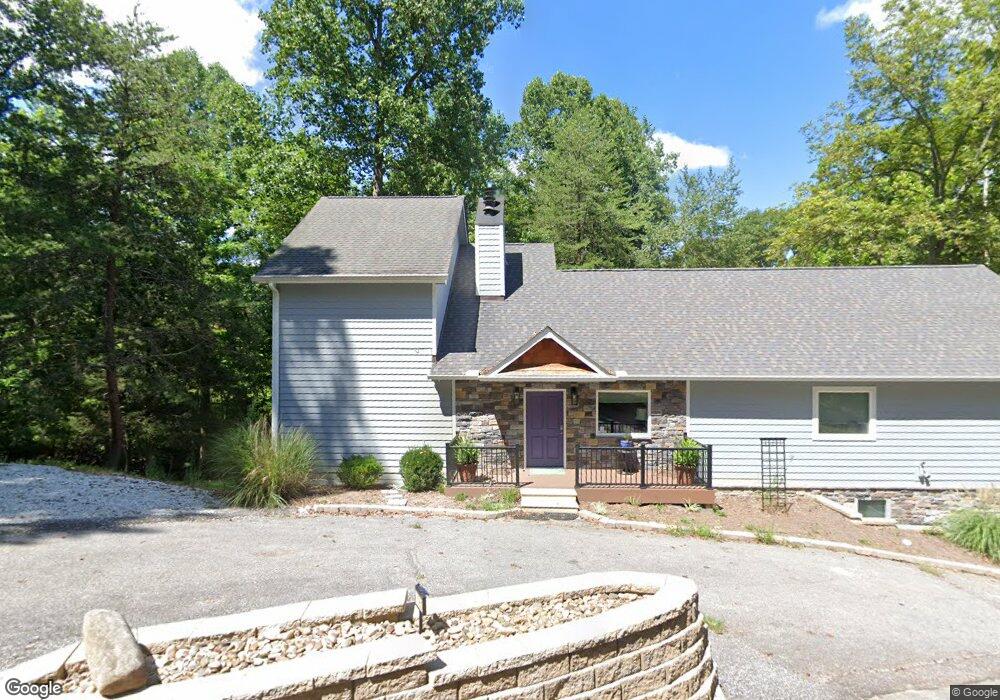
161 Doe Crossing La Follette, TN 37766
Estimated Value: $1,188,000 - $1,312,603
--
Bed
3
Baths
4,274
Sq Ft
$287/Sq Ft
Est. Value
About This Home
This home is located at 161 Doe Crossing, La Follette, TN 37766 and is currently estimated at $1,226,151, approximately $286 per square foot. 161 Doe Crossing is a home located in Campbell County.
Ownership History
Date
Name
Owned For
Owner Type
Purchase Details
Closed on
Aug 23, 2017
Sold by
Korona Mark D and Korona Kathy
Bought by
Langer Jennie P and Powell Anne D
Current Estimated Value
Home Financials for this Owner
Home Financials are based on the most recent Mortgage that was taken out on this home.
Original Mortgage
$315,000
Outstanding Balance
$262,559
Interest Rate
3.92%
Mortgage Type
New Conventional
Estimated Equity
$963,592
Purchase Details
Closed on
Sep 1, 2015
Sold by
Kgw Investments Llc
Bought by
Korona Mark D and Korona Kathy
Purchase Details
Closed on
Mar 13, 2012
Sold by
Korona Mark D
Bought by
Kgw Investments Llc
Purchase Details
Closed on
Oct 30, 2007
Sold by
Welch Terry
Bought by
Korona Mark D
Purchase Details
Closed on
Sep 10, 2004
Sold by
Reighley Robert
Bought by
Welch Terry
Purchase Details
Closed on
Apr 15, 1996
Bought by
Sendelbach Timothy J and Sendelbach Pamela S
Purchase Details
Closed on
Nov 13, 1992
Bought by
Mock Stephen F and Mock Julienne
Create a Home Valuation Report for This Property
The Home Valuation Report is an in-depth analysis detailing your home's value as well as a comparison with similar homes in the area
Home Values in the Area
Average Home Value in this Area
Purchase History
| Date | Buyer | Sale Price | Title Company |
|---|---|---|---|
| Langer Jennie P | $450,000 | Tallent Title | |
| Korona Mark D | -- | -- | |
| Kgw Investments Llc | -- | -- | |
| Korona Mark D | -- | -- | |
| Welch Terry | $290,000 | -- | |
| Sendelbach Timothy J | $249,000 | -- | |
| Mock Stephen F | $52,000 | -- |
Source: Public Records
Mortgage History
| Date | Status | Borrower | Loan Amount |
|---|---|---|---|
| Open | Langer Jennie P | $315,000 |
Source: Public Records
Tax History Compared to Growth
Tax History
| Year | Tax Paid | Tax Assessment Tax Assessment Total Assessment is a certain percentage of the fair market value that is determined by local assessors to be the total taxable value of land and additions on the property. | Land | Improvement |
|---|---|---|---|---|
| 2025 | $3,315 | $272,675 | $0 | $0 |
| 2024 | $3,315 | $272,675 | $94,350 | $178,325 |
| 2023 | $3,074 | $148,775 | $56,250 | $92,525 |
| 2022 | $3,074 | $148,775 | $56,250 | $92,525 |
| 2021 | $2,346 | $113,550 | $56,250 | $57,300 |
| 2020 | $2,323 | $113,550 | $56,250 | $57,300 |
| 2019 | $2,346 | $113,550 | $56,250 | $57,300 |
| 2018 | $2,323 | $103,250 | $48,750 | $54,500 |
| 2017 | $2,323 | $103,250 | $48,750 | $54,500 |
| 2016 | $2,323 | $103,250 | $48,750 | $54,500 |
| 2015 | $2,055 | $103,250 | $48,750 | $54,500 |
| 2014 | $2,055 | $103,250 | $48,750 | $54,500 |
| 2013 | -- | $103,250 | $48,750 | $54,500 |
Source: Public Records
Map
Nearby Homes
- 134 Doe Crossing
- 0 Sam & Maria Lot 28 Way Unit 1298020
- 824 Deerfield Way
- 0 Lot 29 Sam & Maria Way Unit 1298022
- 0 Lot 30 Sam & Maria Way Unit 1298023
- 0 Antlers Way Unit 1260064
- 245 Doe Ln Unit 5
- 111 Deer Run Point
- 0 Deerfield Way Unit 1308162
- 0 Deerfield Way Unit 1304037
- 207 N Deer Hill Village Unit A
- 195 N Deer Village Ln Unit B
- Lot 21 Buckeye Landing
- 163 N Deer Village Ln
- 117 W Deer Hill Village Ln
- 118 E Harbor View Ln Unit A
- 118 E Harbor View Ln Unit B
- 0 Deer Pond Cir Unit 1281466
- 0 Deer Pond Cir Unit 1281469
- 0 Deer Pond Cir Unit 1281473