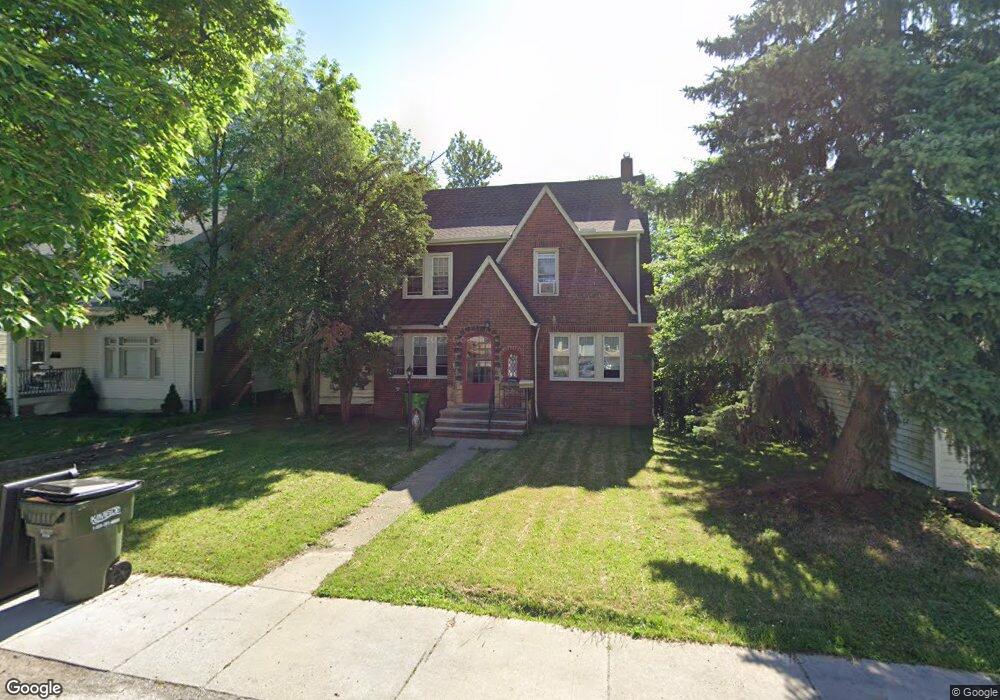
161 E 238th St Euclid, OH 44123
Estimated Value: $100,000 - $182,000
3
Beds
2
Baths
1,702
Sq Ft
$89/Sq Ft
Est. Value
About This Home
This home is located at 161 E 238th St, Euclid, OH 44123 and is currently estimated at $152,057, approximately $89 per square foot. 161 E 238th St is a home located in Cuyahoga County with nearby schools including Bluestone Elementary School, Euclid High School, and Our Lady Of The Lake School.
Ownership History
Date
Name
Owned For
Owner Type
Purchase Details
Closed on
Mar 13, 1999
Sold by
Zurga Olivia
Bought by
Zurga Richard and Zurga Olivia
Current Estimated Value
Home Financials for this Owner
Home Financials are based on the most recent Mortgage that was taken out on this home.
Original Mortgage
$92,000
Outstanding Balance
$22,361
Interest Rate
6.8%
Estimated Equity
$129,696
Purchase Details
Closed on
Mar 28, 1990
Sold by
Zurga Allen D
Bought by
Zurga Olivia
Purchase Details
Closed on
Mar 30, 1985
Sold by
Zurga Allen D
Bought by
Zurga Allen D
Purchase Details
Closed on
Jul 24, 1978
Sold by
Wells Ernie
Bought by
Zurga Allen D
Purchase Details
Closed on
Jul 7, 1975
Sold by
Kobesson Margaret
Bought by
Wells Ernie
Purchase Details
Closed on
Jul 3, 1975
Sold by
Kobesson John and Kobesson Margaret
Bought by
Kobesson Margaret
Purchase Details
Closed on
Jan 1, 1975
Bought by
Kobesson John and Kobesson Margaret
Create a Home Valuation Report for This Property
The Home Valuation Report is an in-depth analysis detailing your home's value as well as a comparison with similar homes in the area
Home Values in the Area
Average Home Value in this Area
Purchase History
| Date | Buyer | Sale Price | Title Company |
|---|---|---|---|
| Zurga Richard | -- | Tower City Title Agency Inc | |
| Zurga Olivia | -- | -- | |
| Zurga Allen D | -- | -- | |
| Zurga Allen D | $52,000 | -- | |
| Wells Ernie | $36,900 | -- | |
| Kobesson Margaret | -- | -- | |
| Kobesson John | -- | -- |
Source: Public Records
Mortgage History
| Date | Status | Borrower | Loan Amount |
|---|---|---|---|
| Open | Zurga Richard | $92,000 |
Source: Public Records
Tax History
| Year | Tax Paid | Tax Assessment Tax Assessment Total Assessment is a certain percentage of the fair market value that is determined by local assessors to be the total taxable value of land and additions on the property. | Land | Improvement |
|---|---|---|---|---|
| 2024 | $2,653 | $47,775 | $9,660 | $38,115 |
| 2023 | $2,386 | $36,300 | $5,110 | $31,190 |
| 2022 | $2,366 | $36,300 | $5,110 | $31,190 |
| 2021 | $2,633 | $36,300 | $5,110 | $31,190 |
| 2020 | $2,607 | $33,600 | $4,730 | $28,880 |
| 2019 | $2,344 | $96,000 | $13,500 | $82,500 |
| 2018 | $2,350 | $33,600 | $4,730 | $28,880 |
| 2017 | $2,529 | $30,980 | $4,660 | $26,320 |
| 2016 | $2,534 | $30,980 | $4,660 | $26,320 |
| 2015 | $2,308 | $30,980 | $4,660 | $26,320 |
| 2014 | $2,308 | $30,980 | $4,660 | $26,320 |
Source: Public Records
Map
Nearby Homes
- 110 E 238th St
- 71 Lake Edge Dr
- 244 E 238th St
- 303 E 235th St
- 323 E 235th St
- 334 E 238th St
- 324 E 235th St
- 368 E 248th St
- 24891 Zeman Ave
- 110 E 252nd St
- 55 Sunnycliff Dr
- 464 E 250th St
- 25151 Zeman Ave
- 25401 Farringdon Ave
- 355 E 257th St
- 325 E 257th St
- 23198 Gay St
- 25731 Zeman Ave
- 25671 Farringdon Ave
- 24181 Devoe Ave
- 151 E 238th St
- 23831 Lake Shore Blvd
- 23821 Lake Shore Blvd
- 141 E 238th St
- 160 E 238th St
- 150 E 238th St
- 170 E 238th St
- 140 E 238th St
- 180 E 238th St
- 121 E 238th St
- 130 E 238th St
- 120 E 238th St
- 23749 Lake Shore Blvd
- 111 E 238th St
- 23749 Lakeshore Blvd
- 23745 Lake Shore Blvd
- 101 E 238th St
- 23701 Lake Shore Blvd
- 100 E 238th St
- 23802 Lake Shore Blvd
Your Personal Tour Guide
Ask me questions while you tour the home.