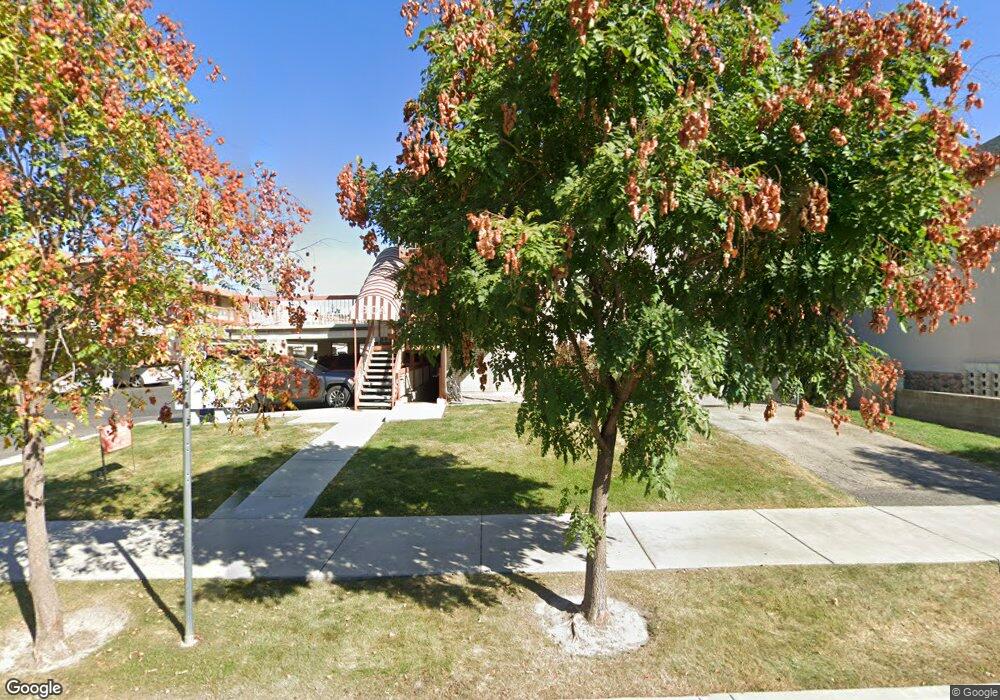
161 E 700 N Unit 13 Provo, UT 84606
Joaquin NeighborhoodEstimated Value: $307,000 - $326,000
2
Beds
1
Bath
921
Sq Ft
$340/Sq Ft
Est. Value
About This Home
This home is located at 161 E 700 N Unit 13, Provo, UT 84606 and is currently estimated at $313,170, approximately $340 per square foot. 161 E 700 N Unit 13 is a home located in Utah County with nearby schools including Provo Peaks School, Centennial Middle School, and Timpview High School.
Ownership History
Date
Name
Owned For
Owner Type
Purchase Details
Closed on
Aug 28, 2020
Sold by
Nelson Mark A and Nelson Bonnie B
Bought by
Anderson Jory L and Anderson Katherine
Current Estimated Value
Home Financials for this Owner
Home Financials are based on the most recent Mortgage that was taken out on this home.
Original Mortgage
$165,000
Outstanding Balance
$146,155
Interest Rate
2.8%
Mortgage Type
New Conventional
Estimated Equity
$167,015
Purchase Details
Closed on
Jun 19, 2002
Sold by
Felhberg Rondo and Fehlberg Mary B
Bought by
Nelson Mark A and Nelson Bonnie B
Home Financials for this Owner
Home Financials are based on the most recent Mortgage that was taken out on this home.
Original Mortgage
$69,000
Interest Rate
6.74%
Purchase Details
Closed on
Aug 1, 1998
Sold by
Witbeck Von H and Witbeck Kerrie B
Bought by
Fehlberg Rondo and Fehlberg Mary B
Home Financials for this Owner
Home Financials are based on the most recent Mortgage that was taken out on this home.
Original Mortgage
$74,400
Interest Rate
6.9%
Create a Home Valuation Report for This Property
The Home Valuation Report is an in-depth analysis detailing your home's value as well as a comparison with similar homes in the area
Home Values in the Area
Average Home Value in this Area
Purchase History
| Date | Buyer | Sale Price | Title Company |
|---|---|---|---|
| Anderson Jory L | -- | Cottonwood Ttl Ins Agcy Inc | |
| Nelson Mark A | -- | First American Title Co | |
| Fehlberg Rondo | -- | -- |
Source: Public Records
Mortgage History
| Date | Status | Borrower | Loan Amount |
|---|---|---|---|
| Open | Anderson Jory L | $165,000 | |
| Previous Owner | Nelson Mark A | $69,000 | |
| Previous Owner | Fehlberg Rondo | $74,400 |
Source: Public Records
Tax History
| Year | Tax Paid | Tax Assessment Tax Assessment Total Assessment is a certain percentage of the fair market value that is determined by local assessors to be the total taxable value of land and additions on the property. | Land | Improvement |
|---|---|---|---|---|
| 2025 | $1,449 | $157,465 | -- | -- |
| 2024 | $1,449 | $142,615 | $0 | $0 |
| 2023 | $1,457 | $141,350 | $0 | $0 |
| 2022 | $1,524 | $149,160 | $0 | $0 |
| 2021 | $1,282 | $218,700 | $26,200 | $192,500 |
| 2020 | $1,264 | $202,200 | $24,300 | $177,900 |
| 2019 | $1,100 | $183,000 | $24,000 | $159,000 |
| 2018 | $990 | $167,000 | $21,000 | $146,000 |
| 2017 | $833 | $77,220 | $0 | $0 |
| 2016 | $827 | $71,500 | $0 | $0 |
| 2015 | $756 | $66,000 | $0 | $0 |
| 2014 | $725 | $66,000 | $0 | $0 |
Source: Public Records
Map
Nearby Homes
- 639 N University Ave Unit 10
- 36 W 700 N Unit 206
- 620 N 100 St W
- 466 N 200 E
- 567 N University Ave Unit 209
- 433 N 300 E
- 136 E 400 N Unit 108
- 232 E 400 N
- 513 E 700 N
- 380 N 200 E
- 394 N 300 E
- 541 E 500 N Unit 12
- 232 E 300 N
- 246 N 200 E
- 386 N 500 E
- 250 N 100 W Unit 109
- 261 N 400 E Unit 301
- 364 N 500 E
- 194 N 100 E
- 735 E 620 N
Your Personal Tour Guide
Ask me questions while you tour the home.