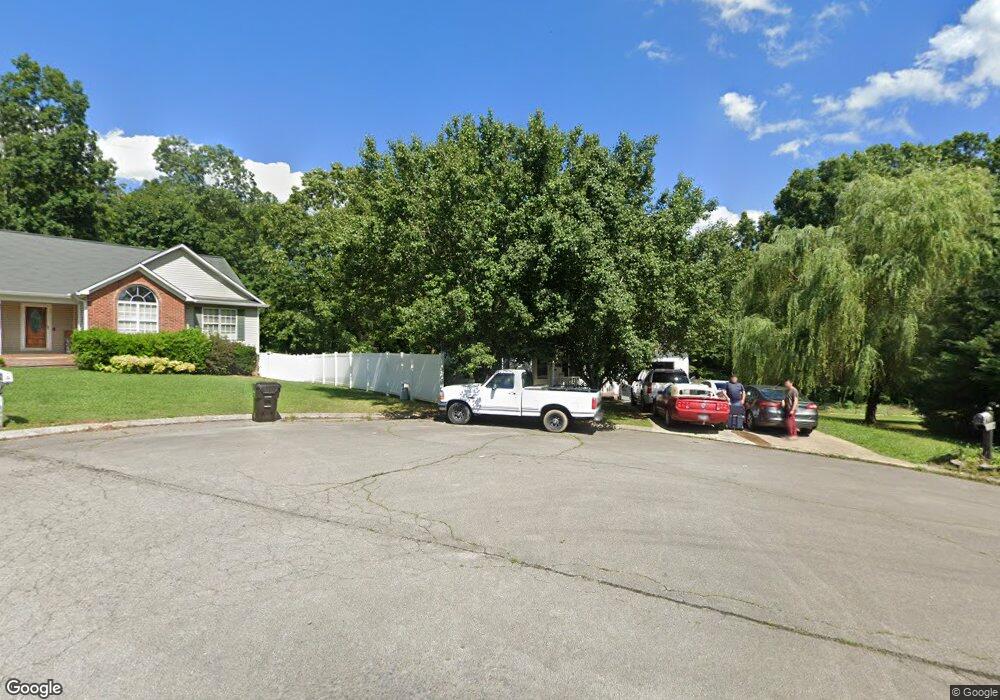
161 Fox Hill Ln SW Cleveland, TN 37311
Estimated Value: $275,217 - $348,000
--
Bed
2
Baths
1,504
Sq Ft
$208/Sq Ft
Est. Value
About This Home
This home is located at 161 Fox Hill Ln SW, Cleveland, TN 37311 and is currently estimated at $313,554, approximately $208 per square foot. 161 Fox Hill Ln SW is a home located in Bradley County with nearby schools including Black Fox Elementary School, Lake Forest Middle School, and Bradley Central High School.
Ownership History
Date
Name
Owned For
Owner Type
Purchase Details
Closed on
Aug 4, 2010
Sold by
Johnson Bryan P
Bought by
Patterson Carl R
Current Estimated Value
Purchase Details
Closed on
Sep 6, 2006
Sold by
Nunn Wadie G
Bought by
Johnson Bruan P
Home Financials for this Owner
Home Financials are based on the most recent Mortgage that was taken out on this home.
Original Mortgage
$132,692
Interest Rate
6.58%
Mortgage Type
VA
Purchase Details
Closed on
Sep 1, 2006
Sold by
Nunn Wadie G
Bought by
Johnson Bruan P
Home Financials for this Owner
Home Financials are based on the most recent Mortgage that was taken out on this home.
Original Mortgage
$132,692
Interest Rate
6.58%
Mortgage Type
VA
Purchase Details
Closed on
Aug 15, 2003
Sold by
Je Nunn
Bought by
Nunn Wadine G
Purchase Details
Closed on
Jan 2, 2003
Sold by
Nunn J E
Bought by
Nunn Wadine G
Create a Home Valuation Report for This Property
The Home Valuation Report is an in-depth analysis detailing your home's value as well as a comparison with similar homes in the area
Home Values in the Area
Average Home Value in this Area
Purchase History
| Date | Buyer | Sale Price | Title Company |
|---|---|---|---|
| Patterson Carl R | $144,900 | -- | |
| Johnson Bruan P | $129,900 | -- | |
| Johnson Bruan P | $129,900 | -- | |
| Nunn Wadine G | -- | -- | |
| Nunn Wadine G | -- | -- |
Source: Public Records
Mortgage History
| Date | Status | Borrower | Loan Amount |
|---|---|---|---|
| Previous Owner | Nunn Wadine G | $132,692 | |
| Previous Owner | Johnson Bruan P | $132,692 |
Source: Public Records
Tax History Compared to Growth
Tax History
| Year | Tax Paid | Tax Assessment Tax Assessment Total Assessment is a certain percentage of the fair market value that is determined by local assessors to be the total taxable value of land and additions on the property. | Land | Improvement |
|---|---|---|---|---|
| 2024 | $783 | $44,050 | $5,000 | $39,050 |
| 2023 | $783 | $44,050 | $5,000 | $39,050 |
| 2022 | $783 | $44,050 | $5,000 | $39,050 |
| 2021 | $783 | $44,050 | $0 | $0 |
| 2020 | $752 | $44,050 | $0 | $0 |
| 2019 | $752 | $33,850 | $0 | $0 |
| 2018 | $716 | $0 | $0 | $0 |
| 2017 | $729 | $0 | $0 | $0 |
| 2016 | $729 | $0 | $0 | $0 |
| 2015 | $723 | $0 | $0 | $0 |
| 2014 | $587 | $0 | $0 | $0 |
Source: Public Records
Map
Nearby Homes
- 128 Fox Hill Ln SW
- 0 Eleanor Dr SW Unit RTC3000217
- 0 Eleanor Dr SW Unit 20254476
- 202 Fox Crest Dr SW
- 8319 Cottage Way SW
- Lot 15 Cobblestone Ridge SW
- Lot 17 Cobblestone Ridge SW
- Lot 18 Cobblestone Ridge SW
- Lot 19 Cobblestone Ridge SW
- Lot 20 Cobblestone Ridge SW
- 8079 Cobblestone Dr SW
- 8136 Cobblestone Dr SW
- 00 Eleanor Dr SW
- 34153339 Lead Mine Valley Rd SW
- 3415/3339 Lead Mine Valley Rd SW
- 275 Lead Mine Valley Rd SW
- 3720 Dockery St SE
- 188 Brown Rd SE
- 193 Brown Rd SE
- 151 Fox Hill Ln SW
- 171 Fox Hill Ln SW
- 141 Fox Hill Ln SW
- 154 Fox Hill Ln SW
- 3556 Blue Springs Rd
- 172 Fox Hill Ln SW
- 110 Ruth Way SW
- 144 Fox Hill Ln SW
- 131 Fox Hill Ln SW
- 111 Ruth Way SW
- 134 Fox Hill Ln SW
- 205 Ruth Ln
- 121 Fox Hill Ln SW
- 3566 Blue Springs Rd
- 112 Fox Hill Ln SW
- 187 Eleanor Dr SW
- 111 Fox Hill Ln SW
- 170 Fox Crest Dr SW
- 170 Fox Ridge Trail
- 166 Fox Crest Dr SW