Estimated Value: $134,000 - $173,266
3
Beds
2
Baths
1,896
Sq Ft
$78/Sq Ft
Est. Value
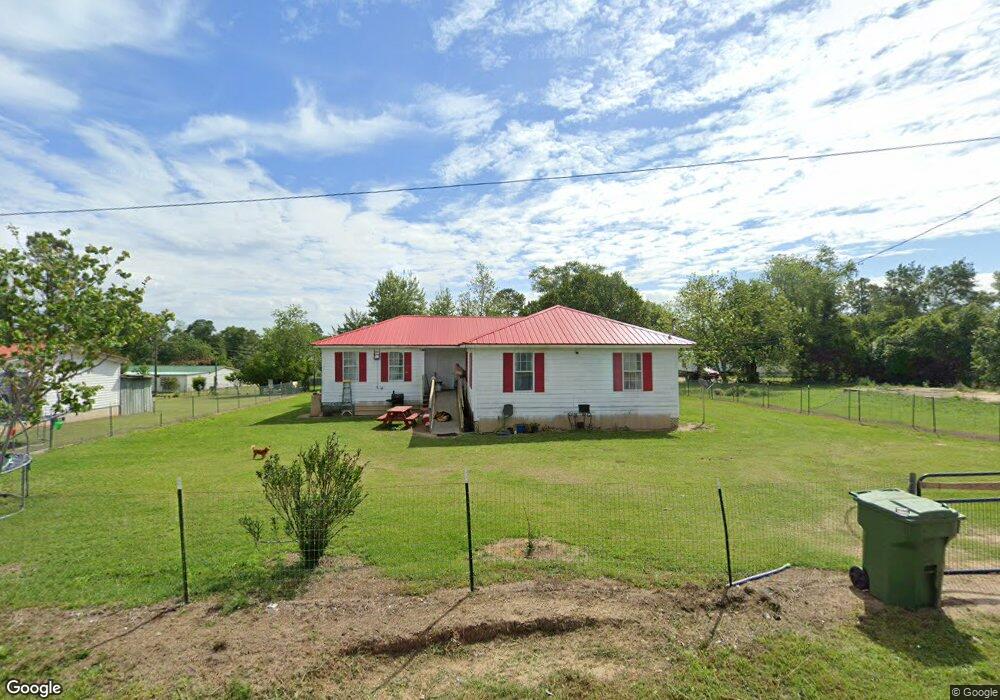
About This Home
This home is located at 161 Maple St, Omega, GA 31775 and is currently estimated at $147,567, approximately $77 per square foot. 161 Maple St is a home with nearby schools including Omega Elementary School, J.T. Reddick School, and Eighth Street Middle School.
Ownership History
Date
Name
Owned For
Owner Type
Purchase Details
Closed on
May 16, 2022
Sold by
Sandoval Cristian Luis
Bought by
Sandoval Gregorio and Santos Concepcin
Current Estimated Value
Purchase Details
Closed on
Feb 26, 2021
Sold by
Us Bank Na Trustee
Bought by
Sandoval Cristian Luis
Home Financials for this Owner
Home Financials are based on the most recent Mortgage that was taken out on this home.
Original Mortgage
$49,800
Interest Rate
2.7%
Mortgage Type
New Conventional
Purchase Details
Closed on
Jan 5, 2021
Sold by
Patino Elizabeth
Bought by
Us Bank Na Trustee and C/O Shellpoint Mtg Servicing
Home Financials for this Owner
Home Financials are based on the most recent Mortgage that was taken out on this home.
Original Mortgage
$49,800
Interest Rate
2.7%
Mortgage Type
New Conventional
Purchase Details
Closed on
Nov 9, 1998
Sold by
Hanson Ella
Bought by
Patino Elizabeth and Patino Patino
Purchase Details
Closed on
Sep 27, 1979
Sold by
Ford Spinks B and Patrick Gibbs
Bought by
Hanson Ella
Create a Home Valuation Report for This Property
The Home Valuation Report is an in-depth analysis detailing your home's value as well as a comparison with similar homes in the area
Home Values in the Area
Average Home Value in this Area
Purchase History
| Date | Buyer | Sale Price | Title Company |
|---|---|---|---|
| Sandoval Gregorio | -- | -- | |
| Sandoval Cristian Luis | $49,800 | -- | |
| Us Bank Na Trustee | $50,202 | -- | |
| Patino Elizabeth | -- | -- | |
| Hanson Ella | $3,000 | -- |
Source: Public Records
Mortgage History
| Date | Status | Borrower | Loan Amount |
|---|---|---|---|
| Previous Owner | Sandoval Cristian Luis | $49,800 |
Source: Public Records
Tax History Compared to Growth
Tax History
| Year | Tax Paid | Tax Assessment Tax Assessment Total Assessment is a certain percentage of the fair market value that is determined by local assessors to be the total taxable value of land and additions on the property. | Land | Improvement |
|---|---|---|---|---|
| 2024 | $1,426 | $65,361 | $1,360 | $64,001 |
| 2023 | $1,550 | $13,811 | $2,200 | $11,611 |
| 2022 | $410 | $13,811 | $2,200 | $11,611 |
| 2021 | $353 | $13,811 | $2,200 | $11,611 |
| 2020 | $359 | $13,811 | $2,200 | $11,611 |
| 2019 | $359 | $13,811 | $2,200 | $11,611 |
| 2018 | $358 | $13,811 | $2,200 | $11,611 |
| 2017 | $360 | $13,811 | $2,200 | $11,611 |
| 2016 | $393 | $14,892 | $2,200 | $12,692 |
| 2015 | $393 | $14,892 | $2,200 | $12,692 |
| 2014 | $394 | $14,892 | $2,200 | $12,692 |
| 2013 | -- | $27,584 | $2,200 | $25,384 |
Source: Public Records
Map
Nearby Homes
- 142 Lamar St
- 146 Lamar St
- 122 New St
- 1427 S Ty Omega Rd
- 160 Main Street Crosland
- 171 Ellis Bryan Rd
- 1396 Livingston Bridge Rd
- 187 Bussell Rd
- 5015 Union Rd
- 54 Jacks Way
- 4554 Carpenter Rd S
- 4502 Carpenter Rd S
- 0 Deer Run Cir
- 45 Surrey Cir
- 33 Surrey Cir
- 4716 Union Rd
- 27 Water's Edge Way
- 17 Waters Edge Way
- 1802 Golden Rd W
- 0 Union Industrial Way