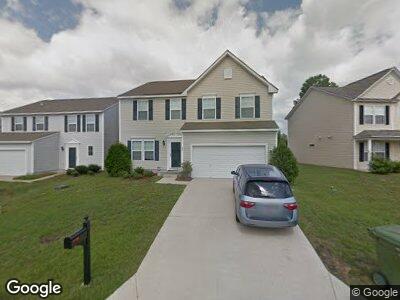
161 Rabon Springs Rd Columbia, SC 29223
Spring Valley NeighborhoodEstimated Value: $271,537 - $333,000
3
Beds
3
Baths
2,510
Sq Ft
$117/Sq Ft
Est. Value
About This Home
This home is located at 161 Rabon Springs Rd, Columbia, SC 29223 and is currently estimated at $292,634, approximately $116 per square foot. 161 Rabon Springs Rd is a home located in Richland County with nearby schools including L. B. Nelson Elementary School, E. L. Wright Middle School, and Richland Northeast High School.
Ownership History
Date
Name
Owned For
Owner Type
Purchase Details
Closed on
Sep 18, 2020
Sold by
Fuison Real Estate Investment Group Llc
Bought by
Cash Jernard T
Current Estimated Value
Home Financials for this Owner
Home Financials are based on the most recent Mortgage that was taken out on this home.
Original Mortgage
$199,485
Interest Rate
2.9%
Mortgage Type
FHA
Purchase Details
Closed on
Feb 13, 2020
Sold by
Morris Charles and Morris Tracey
Bought by
Fusion Real Estate Investment Group Llc
Purchase Details
Closed on
Oct 29, 2009
Sold by
Nvr Inc
Bought by
Morris Charles and Morris Tracey
Home Financials for this Owner
Home Financials are based on the most recent Mortgage that was taken out on this home.
Original Mortgage
$146,207
Interest Rate
5.04%
Mortgage Type
VA
Purchase Details
Closed on
Jul 20, 2009
Sold by
Gs Jacobs Creek Llc
Bought by
Nvr Inc
Create a Home Valuation Report for This Property
The Home Valuation Report is an in-depth analysis detailing your home's value as well as a comparison with similar homes in the area
Home Values in the Area
Average Home Value in this Area
Purchase History
| Date | Buyer | Sale Price | Title Company |
|---|---|---|---|
| Cash Jernard T | $199,000 | None Available | |
| Cash Jernard T | $199,000 | None Listed On Document | |
| Fusion Real Estate Investment Group Llc | $120,000 | None Available | |
| Morris Charles | $143,130 | -- | |
| Nvr Inc | $84,000 | -- |
Source: Public Records
Mortgage History
| Date | Status | Borrower | Loan Amount |
|---|---|---|---|
| Open | Cash Jernard T | $207,231 | |
| Closed | Cash Jernard T | $199,485 | |
| Previous Owner | Morris Charles | $140,760 | |
| Previous Owner | Morris Charles | $146,207 |
Source: Public Records
Tax History Compared to Growth
Tax History
| Year | Tax Paid | Tax Assessment Tax Assessment Total Assessment is a certain percentage of the fair market value that is determined by local assessors to be the total taxable value of land and additions on the property. | Land | Improvement |
|---|---|---|---|---|
| 2024 | $2,249 | $228,900 | $0 | $0 |
| 2023 | $2,249 | $7,960 | $0 | $0 |
| 2022 | $2,010 | $199,000 | $26,000 | $173,000 |
| 2021 | $6,988 | $7,960 | $0 | $0 |
| 2020 | $1,774 | $6,680 | $0 | $0 |
| 2019 | $1,753 | $6,680 | $0 | $0 |
| 2018 | $1,602 | $5,940 | $0 | $0 |
| 2017 | $1,572 | $5,940 | $0 | $0 |
| 2016 | $1,567 | $5,940 | $0 | $0 |
| 2015 | $1,561 | $5,940 | $0 | $0 |
| 2014 | $1,558 | $148,600 | $0 | $0 |
| 2013 | -- | $5,940 | $0 | $0 |
Source: Public Records
Map
Nearby Homes
- 172 Rabon Springs Rd
- 209 Rabon Springs Rd
- 94 Winterberry Ln
- 1536 Rabon Farms Ln
- 97 Charmont Dr
- 1270 Rabon Pond Dr
- 100 Southlake Rd
- 10 Westlake Rd
- 5 Northlake Rd
- 109 Southlake Ct
- 141 Westbridge Rd
- 128 Irongate Dr
- 105 Lionsgate Dr
- 14 Northlake Rd
- 5 Briar Ct S
- 225 Greengate Dr
- 228 Brookspring Rd
- 627 Folkstone Rd
- 15 Glenlake Rd
- 308 Great Rd N
- 161 Rabon Springs Rd
- 157 Rabon Springs Rd
- 165 Rabon Springs Rd
- 153 Rabon Springs Rd
- 173 Rabon Springs Rd
- 149 Rabon Springs Rd
- 164 Rabon Springs Rd
- 156 Rabon Springs Rd
- 160 Rabon Springs Rd
- 177 Rabon Springs Rd
- 168 Rabon Springs Rd
- 152 Rabon Springs Rd
- 145 Rabon Springs Rd
- 176 Rabon Springs Rd
- 181 Rabon Springs Rd
- 148 Rabon Springs Rd
- 144 Rabon Springs Rd
- 141 Rabon Springs Rd
- 180 Rabon Springs Rd
- 185 Rabon Springs Rd