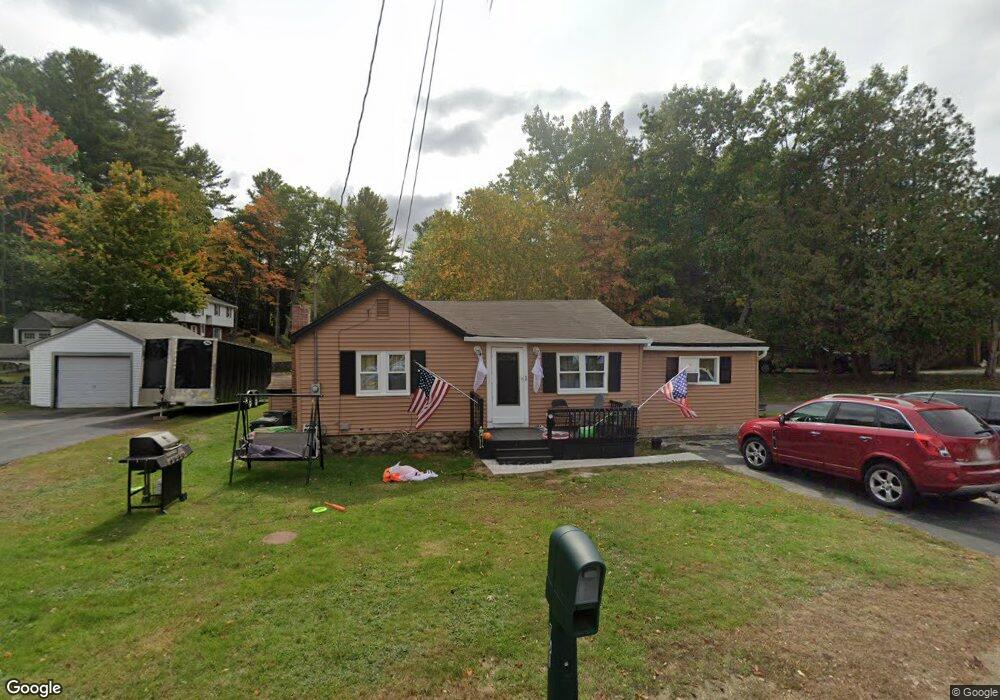
161 Ryan St Gardner, MA 01440
Estimated Value: $257,000 - $320,000
2
Beds
1
Bath
937
Sq Ft
$300/Sq Ft
Est. Value
About This Home
This home is located at 161 Ryan St, Gardner, MA 01440 and is currently estimated at $281,165, approximately $300 per square foot. 161 Ryan St is a home located in Worcester County with nearby schools including Gardner High School and Holy Family Academy.
Ownership History
Date
Name
Owned For
Owner Type
Purchase Details
Closed on
Aug 11, 2000
Sold by
Laliberte Linda M
Bought by
Indeglia David
Current Estimated Value
Purchase Details
Closed on
Jul 14, 1995
Sold by
Lajoie Richard and Lajoie Janet
Bought by
Laliberte Linda
Purchase Details
Closed on
Nov 21, 1990
Sold by
Duplessie Barbara J
Bought by
Lajoie Richard D
Create a Home Valuation Report for This Property
The Home Valuation Report is an in-depth analysis detailing your home's value as well as a comparison with similar homes in the area
Home Values in the Area
Average Home Value in this Area
Purchase History
| Date | Buyer | Sale Price | Title Company |
|---|---|---|---|
| Indeglia David | $65,000 | -- | |
| Laliberte Linda | $54,500 | -- | |
| Lajoie Richard D | $29,000 | -- | |
| Indeglia David | $65,000 | -- | |
| Laliberte Linda | $54,500 | -- | |
| Lajoie Richard D | $29,000 | -- |
Source: Public Records
Mortgage History
| Date | Status | Borrower | Loan Amount |
|---|---|---|---|
| Open | Lajoie Richard D | $93,000 | |
| Closed | Lajoie Richard D | $75,492 |
Source: Public Records
Tax History
| Year | Tax Paid | Tax Assessment Tax Assessment Total Assessment is a certain percentage of the fair market value that is determined by local assessors to be the total taxable value of land and additions on the property. | Land | Improvement |
|---|---|---|---|---|
| 2025 | $30 | $210,300 | $66,800 | $143,500 |
| 2024 | $2,964 | $197,700 | $60,700 | $137,000 |
| 2023 | $2,770 | $171,700 | $59,800 | $111,900 |
| 2022 | $2,474 | $133,100 | $45,300 | $87,800 |
| 2021 | $2,377 | $118,600 | $39,400 | $79,200 |
| 2020 | $2,296 | $116,300 | $39,400 | $76,900 |
| 2019 | $2,264 | $112,400 | $39,400 | $73,000 |
| 2018 | $2,090 | $103,100 | $39,400 | $63,700 |
| 2017 | $2,017 | $98,500 | $39,400 | $59,100 |
| 2016 | $1,936 | $94,600 | $39,400 | $55,200 |
| 2015 | $1,858 | $93,000 | $39,400 | $53,600 |
| 2014 | $1,883 | $99,800 | $43,800 | $56,000 |
Source: Public Records
Map
Nearby Homes
Your Personal Tour Guide
Ask me questions while you tour the home.